Introduction
In March 2025, DeeZee will meet with their Ford Motor Company partners regarding the Ppk of various parts that the operators have measured throughout the past four years. DeeZee is working on consolidating various histograms and charts to show an improvement in the quality of their parts and their conformance to the required tolerances and specifications set by Ford Motor Company, as well as the process control variables required by Ford Motor Company. This Ppk value is set at 1.33 by Ford Motor Company and Dee Zee themselves.
After analyzing historical data on two parts in particular and reviewing DeeZee's processes, the team found many sections of these parts that fall under the 1.33 Ppk value set. Specifically, the team found that 24 out of the 44 given measurement values (22 points x 2 parts) do not reach the targeted Ppk threshold. In discussion with the team from DeeZee, the team also found that specific low Ppk measurements were associated with points susceptible to reproducibility variation for various reasons.
Methods
Based on the problem description by the engineers at DeeZee, there were two main methods the team decided to focus on: how to analyze historical data, and ways to improve areas of potential nonconformity. Given the project's scope and various time constraints, these two avenues of investigation seemed the most efficient and widely applicable to processes outside of this project.
The historical data spans almost four years, from January 2020 to October 2024. After loading a part onto a specially designed platform, the operators use a laser gauge to measure each of the 22 features per part, and these measurements are then automatically collected and put into a spreadsheet. In addition to the measurements, there are also variables for part identity (such as barcode number), date and time, and engineering specifications. There are two notable gap periods within this data: the COVID-19 lockdown and the time when the data collection system was unintentionally disconnected. These periods are around four months long, in 2020 and 2023 respectively. In total, there are 4089 observations with 137 variables.
To supplement the current analytical tools at DeeZee, it was essential to figure out existing limitations in their systems. It has been set up that many of the values and visuals valid for analysis are already being calculated. Summary statistics like mean, standard deviation, graphs for distributions, and control charts are created automatically. There are also calculated Ppk values that helped to see initially where process capability issues might exist. However, many of these outputs are limited to 30 observations, while they are looking for analysis over the entire four-year period.
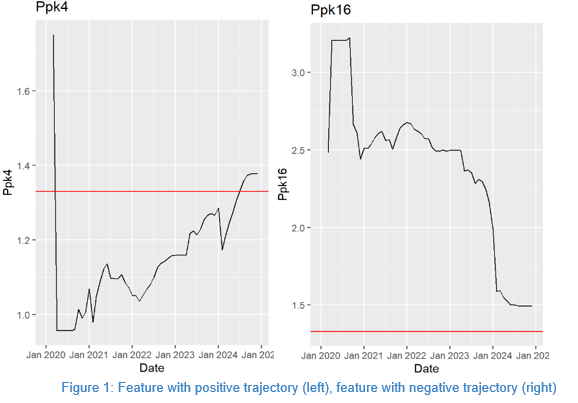
Using RStudio, Youngjae Cho and Ryan Nagao (Data Analysis position) created scripts that would perform these various four-year analyses. Given the specific request of Ford Motor Company, the initial script created a graph visualizing Ppk over the four years. This script would help the engineers at DeeZee see the trajectory of Ppk across the 44 features and assess whether a feature was progressing in a positive or negative direction (Figure 1).
Following the creation of the Ppk graphs and subsequent discussions with the engineers at DeeZee, it became clear that there were observations in the data with extreme measurement values that were impacting any calculations not robust to these outliers, including Ppk. Using RStudio, the team found these extreme values in two different ways.
The first method was by looking at whether or not a feature from a part was within engineering specifications, based on a pass-fail variable that existed within the provided data. The team found one observation per part with over 20 features outside of specifications, which were then deemed anomalous.
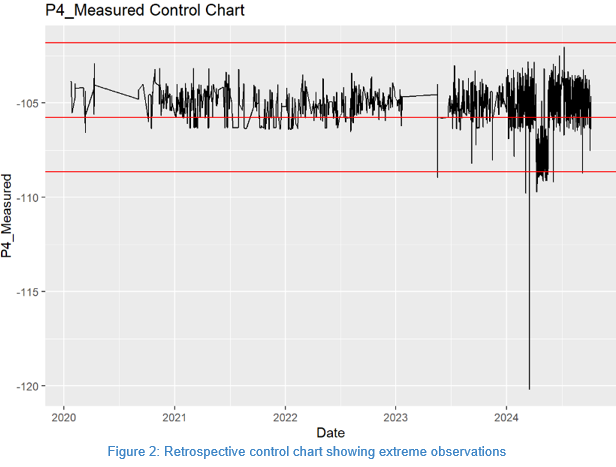
The second method involved more statistical intuition. Each of the 44 features comes from a normal or approximately normal distribution. With this being the case, the team wanted to assess the existence of observations more than three standard deviations from the mean. To visualize this, the team created retrospective control charts spanning four years (Figure 2). The team decided to consider parts with ten or more out-of-control features anomalous.
Parallel to the historical data analysis was a Gauge R&R intended to assess variation in the measurement of the parts. With the physical acts of loading the part on the measurement station and using the laser probe, it was deemed highly possible that variation was being added to the measurements outside of random noise.
A first Gauge R&R was conducted with team members present to observe, with follow-up experiments undertaken in-house by the engineers at DeeZee. The initial study saw four operator groups measuring ten different parts. The results were then processed and visualized. In addition to assessing sources of variation, two of the selected parts were also intentionally out of specification to see if false flags for good or bad parts were possible. Further studies by DeeZee corroborated the results of the first.
Results/Discussion
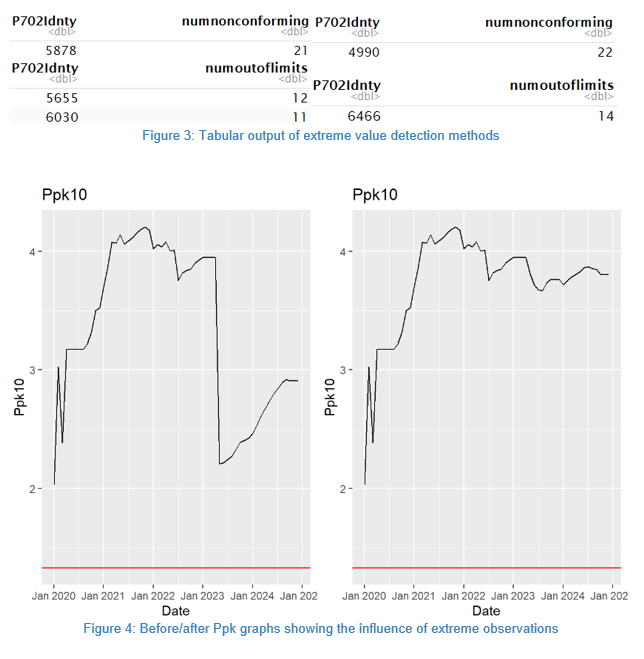
After discussing the extreme measurements with the engineers from DeeZee, it was decided that it would be helpful to see these values' visual impact on the data. As such, the script that generated the Ppk graphs was updated to show before and after removing these observations from the data. Five total observations were removed from the criteria established by the team, three from one part and two from the other (Figure 3), and the graphs were generated with this change (Figure 4).
It becomes evident that these extreme observations have the potential to significantly impact how various values are calculated, most relevantly Ppk. However, their removal from the considered data is only valid because they come from genuine error rather than being an anomalous yet authentic product of the process. In discussions with the engineers from DeeZee, it was concluded that these measurements most likely came from genuine manual errors, so they were considered as such.
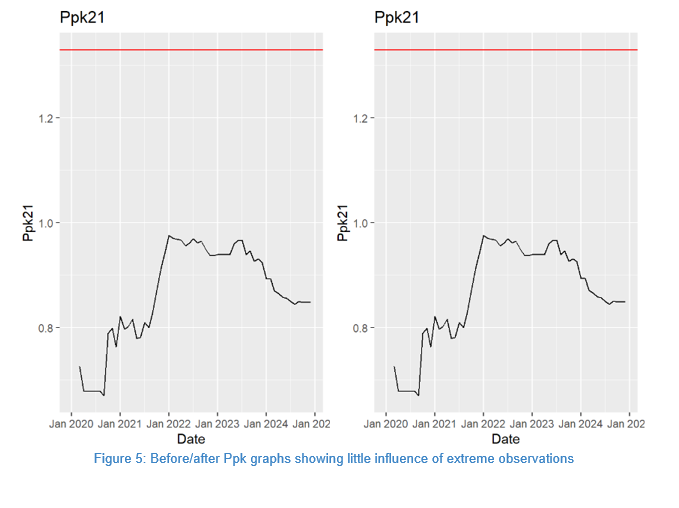
In many of the features, it was also the case that removing extreme observations had little impact on the Ppk (Figure 5). Based on visual judgment, only 16 of the 44 features were determined to have a clear and relevant difference when extreme observations were removed. Even within these different features, there were still examples where the trajectory would be considered harmful (Figure 6). These extreme measurements can only be considered part of the overall problem.
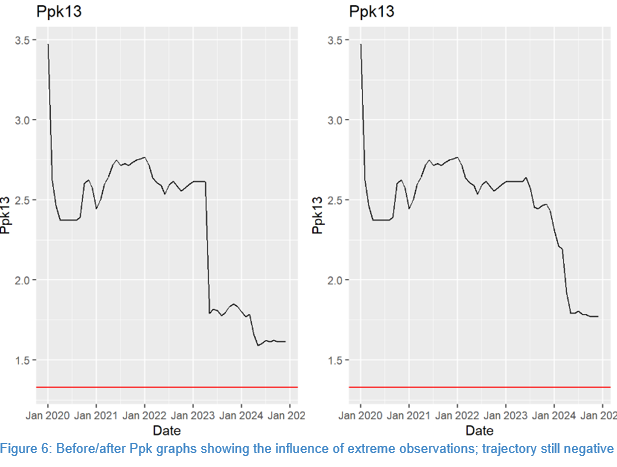
Based on the analysis, the team finds that 13 of the 44 features (eight on one part and five on the other) are on a good Ppk trajectory. A good trajectory is either trending upward or consistently above the Ppk threshold of 1.33 (Figure 7). Other features are either below 1.33 and not showing signs of improvement or are above 1.33 and showing enough of a downward trajectory to be of concern (Figure 6).
Edit continued...