In this Macro Base Assets Part 2, there are three main assets, for example, Bitcoin, NASDAQ, and S&P 500. I will use RSI, Fibonacci Retracement, five Harmonic patterns if possible, and MA or EMA. This portfolio shows how I detect market structures, interpret key signals, and develop actionable outcomes across macro-assets and equity movements. From this Macro Base Assets Part 2, I would reflect how I think, not just what I see.
## Macro Base Assets Part 2 with Bitcoin, NASDAQ, and S&P 500 ##
1. Bitcoin (BTC)
a. Bitcoin Index - 4H ~ Weekly Chart Analysis
Chart Source : TradingView (4H ~ 1W Interval)
Tool Used : EMA(20), MA(200), Fibonacci Retracement, Harmonic Crab and Shark Patterns, RSI(20), Volume
# Bitcoin (BTC Index) Interpretation and Forecasting:
Bitcoin Weekly Chart (Figure above)
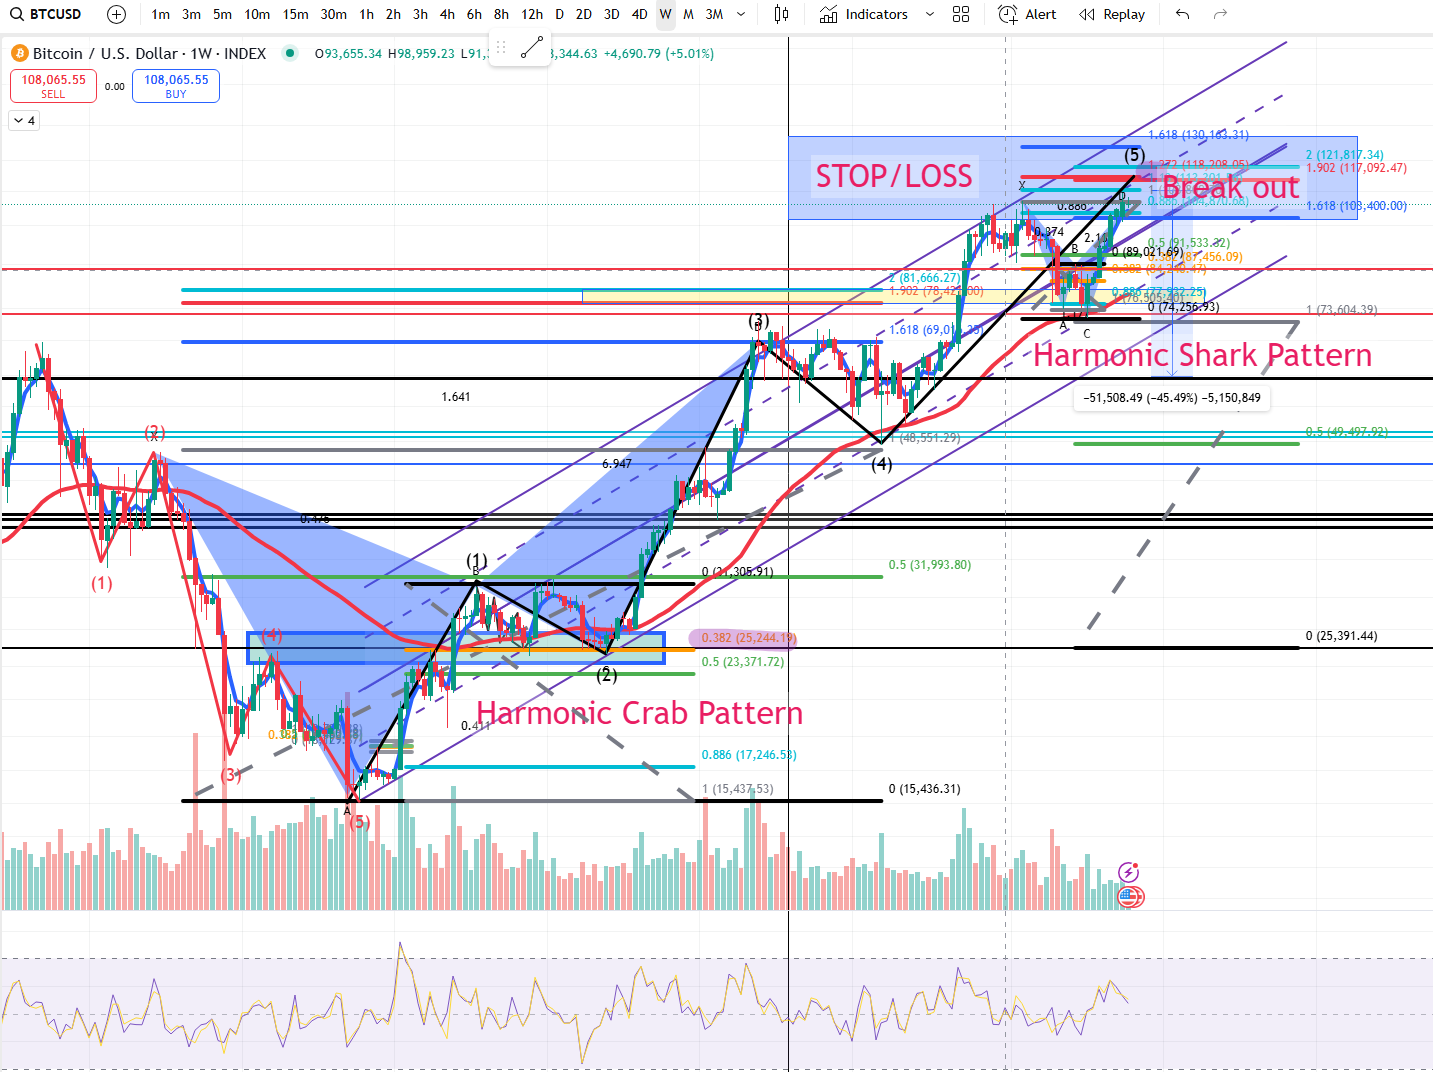
In the big picture, Bitcoin is currently at the end of a five-wave rising wave of (1-2-3-4-5) typical Elliott Wave Theory. With the advent of the Covid-19 pandemic and high inflation, the most beneficial investment item was Bitcoin, this rose to 69K. After building two highs at 69k, a downward divergence brought in the abc(1-2-3-4-5 counting) price adjustment. Then, on November 19, 2022, after the price reversal wave ended, a new impulse rising wave began as shown in the figure above. 1-2 and 3-4 are 1:1 with each other and a five-wave rising wave, currently around 108.2k, but so far, the rise does not seem to have been completed.
In the rising field starting at 15k, the harmonic crab pattern was noticeably found. Point B was located at Fibonacci 0.5 of XA, and it started to rebound in the Fibonacci 0.5 section of the AB section, with a minimum PRZ area of 69,171 dollars, near the All Time High.
After that, the adjustment wave began through a period adjustment was made over a period of 1.5 year. The reason for determining that it was a period adjustment rather than a price adjustment was that the EMA(20) line never fell below the MA(200) line since the Golden-Cross occurred on September 13, 2023. It always rebounded from the long-term moving average of 200 days and got a 100 percent return. There were a new ATH above $100,000 from $51,706.
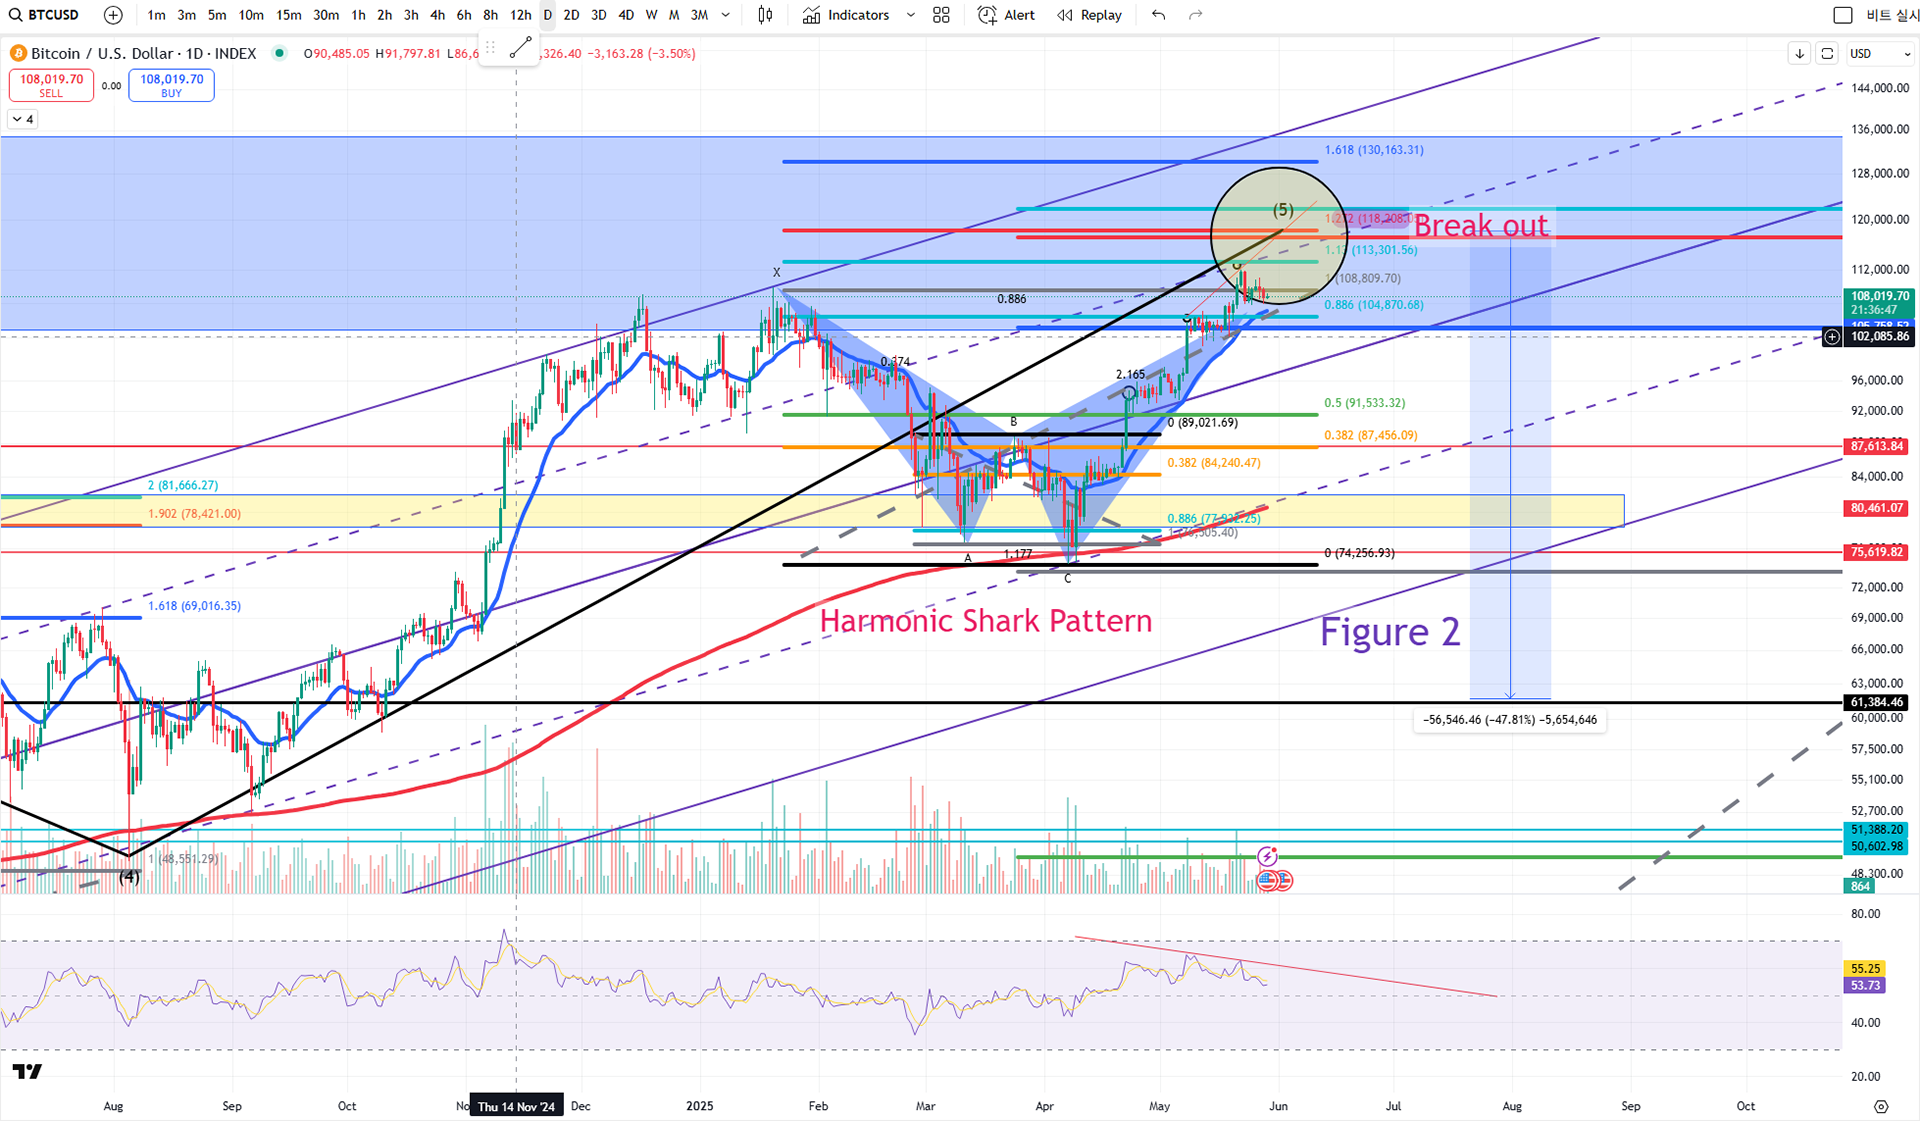
Bitcoin Daily Chart (Figure 2)
Bitcoin Mid-term & Short-term Technical Outlook (As of Late May 2025)
Trend Summary & Price Action:
Over the past 50 days, Bitcoin has gone through three periods of time-based consolidation, however, there's no significant price correction. Therefore, we knew that there has a persistent bullish strength. Except for the 4 hour timeframe, most other timeframes show a relatively stable uptrend.
A. 4H Chart Divergence Risk
1. On the 4 hour RSI(20), three consecutive peaks have formed a bearish divergence trendline.
2. Typically, when three or more RSI divergences emerge, it increases the probability of a downside correction.
3. Caution is advised because of this multi-divergence structure.
B. U.S. Tariff News
On May 23, 2025, the U.S. announced a 50% tariff on EU imports, then an immediate drop occurred. However, the 4 hour
divergence has not yet fully translated into the daily chart. So, further confirmation is needed.
C. Forward Scenarios & Key Levels
There are two possible pullback zones are emerging:
a. Around $110,500 - could become a bearish retest zone.
b. Around $105,485 - prior All Time High (ATH) area, now possibly acting as a bullish retest level.
The next direction will depend on the candle body strength and rely on the price holds above or below those key levels.
D. Multi-Timeframe Monitoring Strategy
For clarity, upcoming analysis will follow this top-down approach:
a. Start with 4H and Daily candles.
b. Then examine Weekly and Monthly charts with a new monthly candle that forms in June. (4 days left)
It is crucial to see where the monthly candle opens and closes in relation to historical support and resistance zones.
E. RSI & Resistance with 4H Observations
There are three observations as follows below:
1. The first minor pullback already occurred in the 4H chart.
2. RSI(20) showed rejection near the 60 level that suggests the momentum loss.
3. This RSI structure indicates that resistance is not yet fully absorbed.
F. Short-Term Price Structure in Daily Chart
An h pattern or sideways range may emerge unless the May 2025 low breaks. And a strong daily close price on May 28 above $107.3k is critical for sustaining the uptrend. If this level is held and followed by supportive price action the next day, the possibility that a rebound may occur get higher.
G. Harmonic Shark Pattern to forecast new ATH price
Before May 25, 2025, ATH was occurred at $108,809.7. The Harmonic Shark Pattern was noticeably observed. Point B, located between 0.382 and 0.618 of XA, rebounded from the point of 1.272, then bounced back to around the PRZ minimum of 0.886 ($104,870). It bounced back to $111,806 and reached all time high again. Apart from the tariff news, we know about the drop on May 23 due to bearish divergence at the peak following the four-hour ~ daily ~ weekly marks. The fall should not drag on to the peak but the points to note most at the peak are 101,232.18 and 101,969.95. If this point is unconditionally maintained through this week and next week, it has the potential to make another upward leap. However, if it falls off resistance at 104,870 dollars, the possibility of a drop increases and it may fall to around the Fibonacci 0.5 line of 91,531.13. In the worst case scenario, a picture of retesting $74,252.56 may come out, but for now, it is hard to judge because the candle is coming out of the peak that prevents the decline. This week and next week will be the most significant, and the upcoming FOMC meetings and PMI announcements would be important to look at.
H. Buy Trigger Zone & Hedging setup
From a buy-side perspective, at least $105k must be broken for a strong accumulation zone to emerge. During this corrective process, there might be chances to hedge through short positions if momentum weakens.
Conclusion
To sum up, Bitcoin is showing strong momentum, but signs of bearish divergence on the 4H chart should not be ignored. Key support levels at $105K ~ $107K will determine whether this is a healthy correction or the start of deeper retracement. We should mark the close price at the range from $101,232.18 and $101,969.95 at the weekly cycle. Because the monthly cycle is approaching, the EMA 30-day line is the most crucial at this moment. If the EMA line is broken, the harmonic shark pattern above and the two prices in weekly range are the most important. If a new candle at the weekly and monthly cycles supports the ranges from $101,232.18 and $101,969.95, a new ATH could be created and the section is expected to be 130K. However, if the bearish divergence seen at the peak is not resolved and resistance is met at the two sections, the possibility of adjustment up to the Fibonacci 0.5 line in the harmonics shark pattern should be open.
2. NASDAQ (NDX)
a. Nasdaq 100 Index - 1M Interval
Chart Source : TradingView (1M Cycle)
Tool Used : EMA(30), MA(200), Fibonacci Retracement, Harmonic Butterfly Pattern, RSI(30), Volume
# Nasdaq 100 Index (NDX) Interpretation & Forecasting
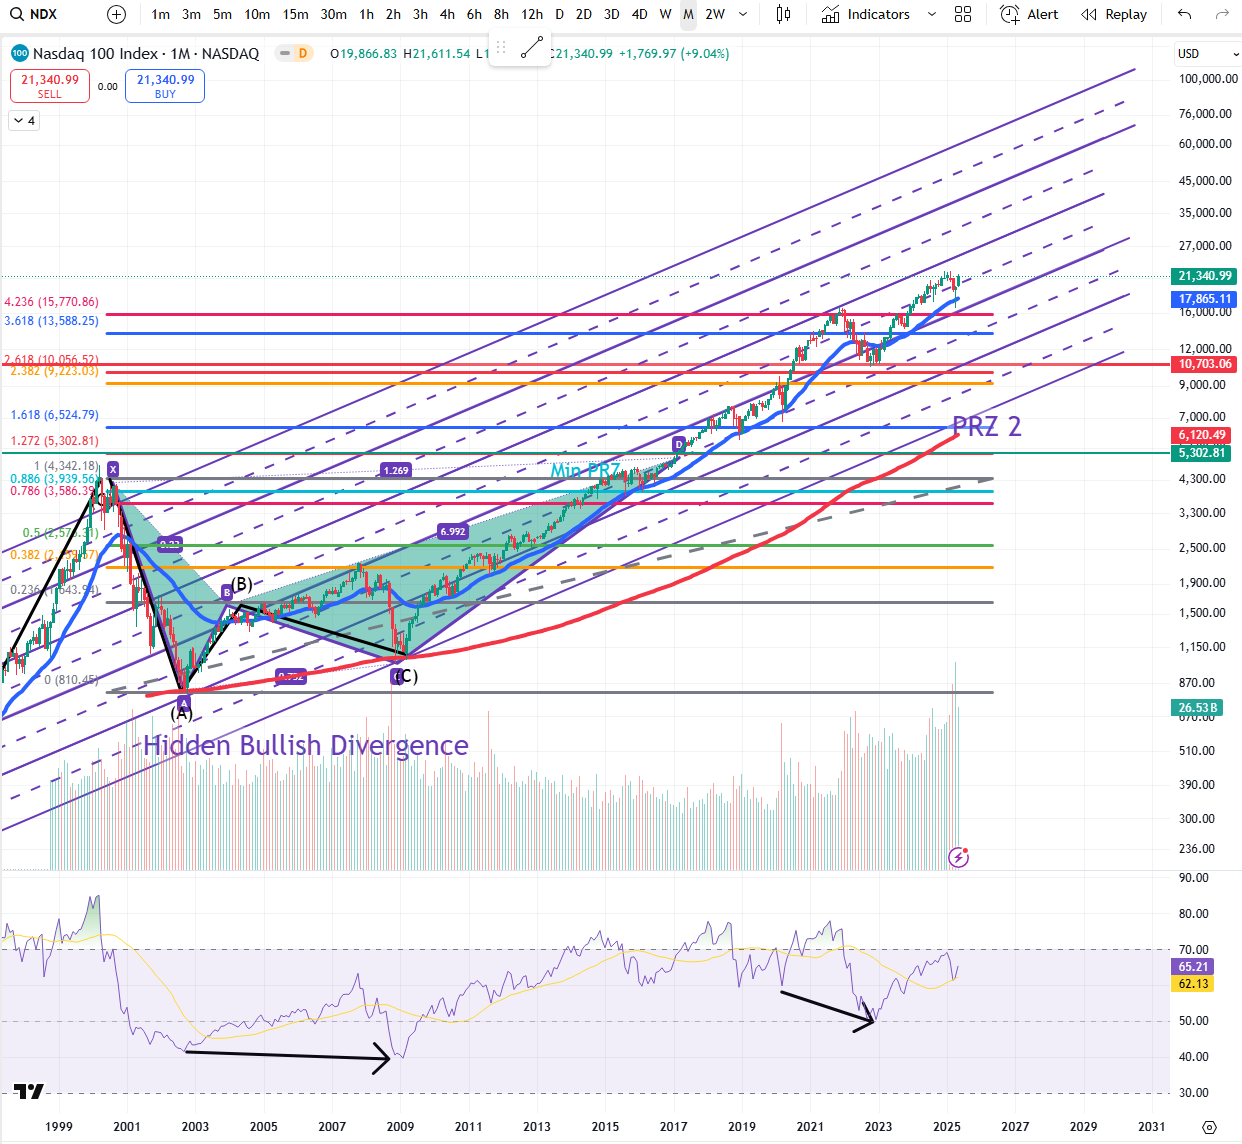
- Harmonic Pattern : Long-Term Bullish Butterfly
A strong impulse wave built on August 2000 after ABC corrective pattern over 2 years and 1 month and ending around July 2002. During this period, hidden bullish divergence formed on RSI(30) near the 30 level. A Bullish Butterfly pattern emerged : Point B retraced to 0.786 of XA, Point C bounced near 0.886 of XA. The Potential Reversal Zone (PRZ) was defined between minimum ($5,302 - 0.886 retracement) and maximum ($6,524.79 - 1.618 extension). After reaching the PRZ sections, these levels did not act as resistance but rather as multi-point support line.
# EMA & Long-Term Moving Averages
In March 2020, a time-based correction retraced near the MA(200), followed by a renewed impulse wave that peaked around November 2021. The XA 2.618 extension did not act as resistance line. Instead, it supported the price and strength the bullish case. A second hidden bullish divergence emerged from RSI(30) near the 30 level, again validating the upward breakout. A hypothetical accumulation point would have been $10,703.06 where confluence occurred between Channel support, Fibonacci extension, RSI divergence, and Volume confirmation.
# Channel Structures and Fibonacci Zones
Five major ascending channels are mapped. (purple) Among five channels, the fourth channel presented the most resistance with 2.618 Fibonacci zone. Price successfully broke through this zone due to strong volume.
# Price Action & Resistance/Support lines
The all-time high (ATH) at $22,341 has recently been surpassed by a new ATH of $22,372.4. However, price has stalled under this level for several weeks. It should be found the support line once again at the EMA(30). The section $22,372.4 is now acting as the key resistance, but if a new monthly candle closes above this level, the upper green resistance line may flip to support.
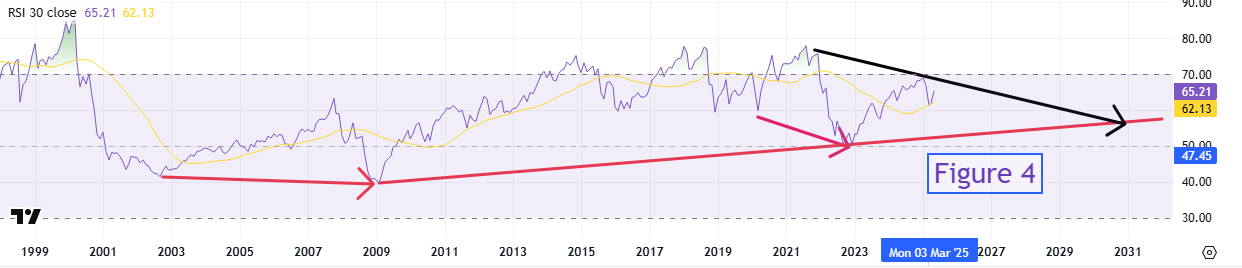
# Divergence & RSI Triangle Structure
Between the previous ATH and current ATH, RSI(30) shows a bearish divergence. However, hidden bullish divergence remains intact. If RSI breaks lower, it may fall to 53.3 level when a triangle structure (converging trendlines) is formed between divergence points. These lines (red line) show the baseline of the two hidden bullish divergences. (Figure 4)
Downside Scenarios (Support Zones)
Trigger Support Target
Break below $20,340 $19,760 or $19,240
Severe correction $17,865 (EMA-30)
# Discussion : Due to the first hidden bullish divergence, price has never fallen to the MA(200) and it shows the power of long-term structural support.
Upside Scenarios (Next ATH Target)
# Discussion : If price reclaims and holds above the green resistance line, it could rise toward $24,976. This level aligns with the top of the 3rd ascending channel and a potential RSI (30) divergence zone near 67.79
Volume & Momentum Interpretation
# Discussion : Volume during the breakout from the 4th channel zone was the strongest and it confirmed bullish commitment. From 2021 to 2024 correction,
it did not break any key structural MAs or RSI divergences.
Conclusion
To sum up, I can conclude to rising price because of a long-term Bullish Butterfly pattern completion, EMA(30) that acting as firm support repeatably, ongoing hidden bullish divergences, no breakdown to MA(200), and an intact ascending channel structure. There is more possibility likely that Nasdaq 100 will continue upward toward $24,976 if the green line flips into support and RSI(30) confirms breakout above the divergence zone.
3. S&P500 (SPX)
a. S&P 500 Index - 1M Interval
Chart Source : TradingView (1M Cycle)
Tool Used : EMA(30), MA(200), Fibonacci, Harmonic Gartley Pattern, RSI(30)
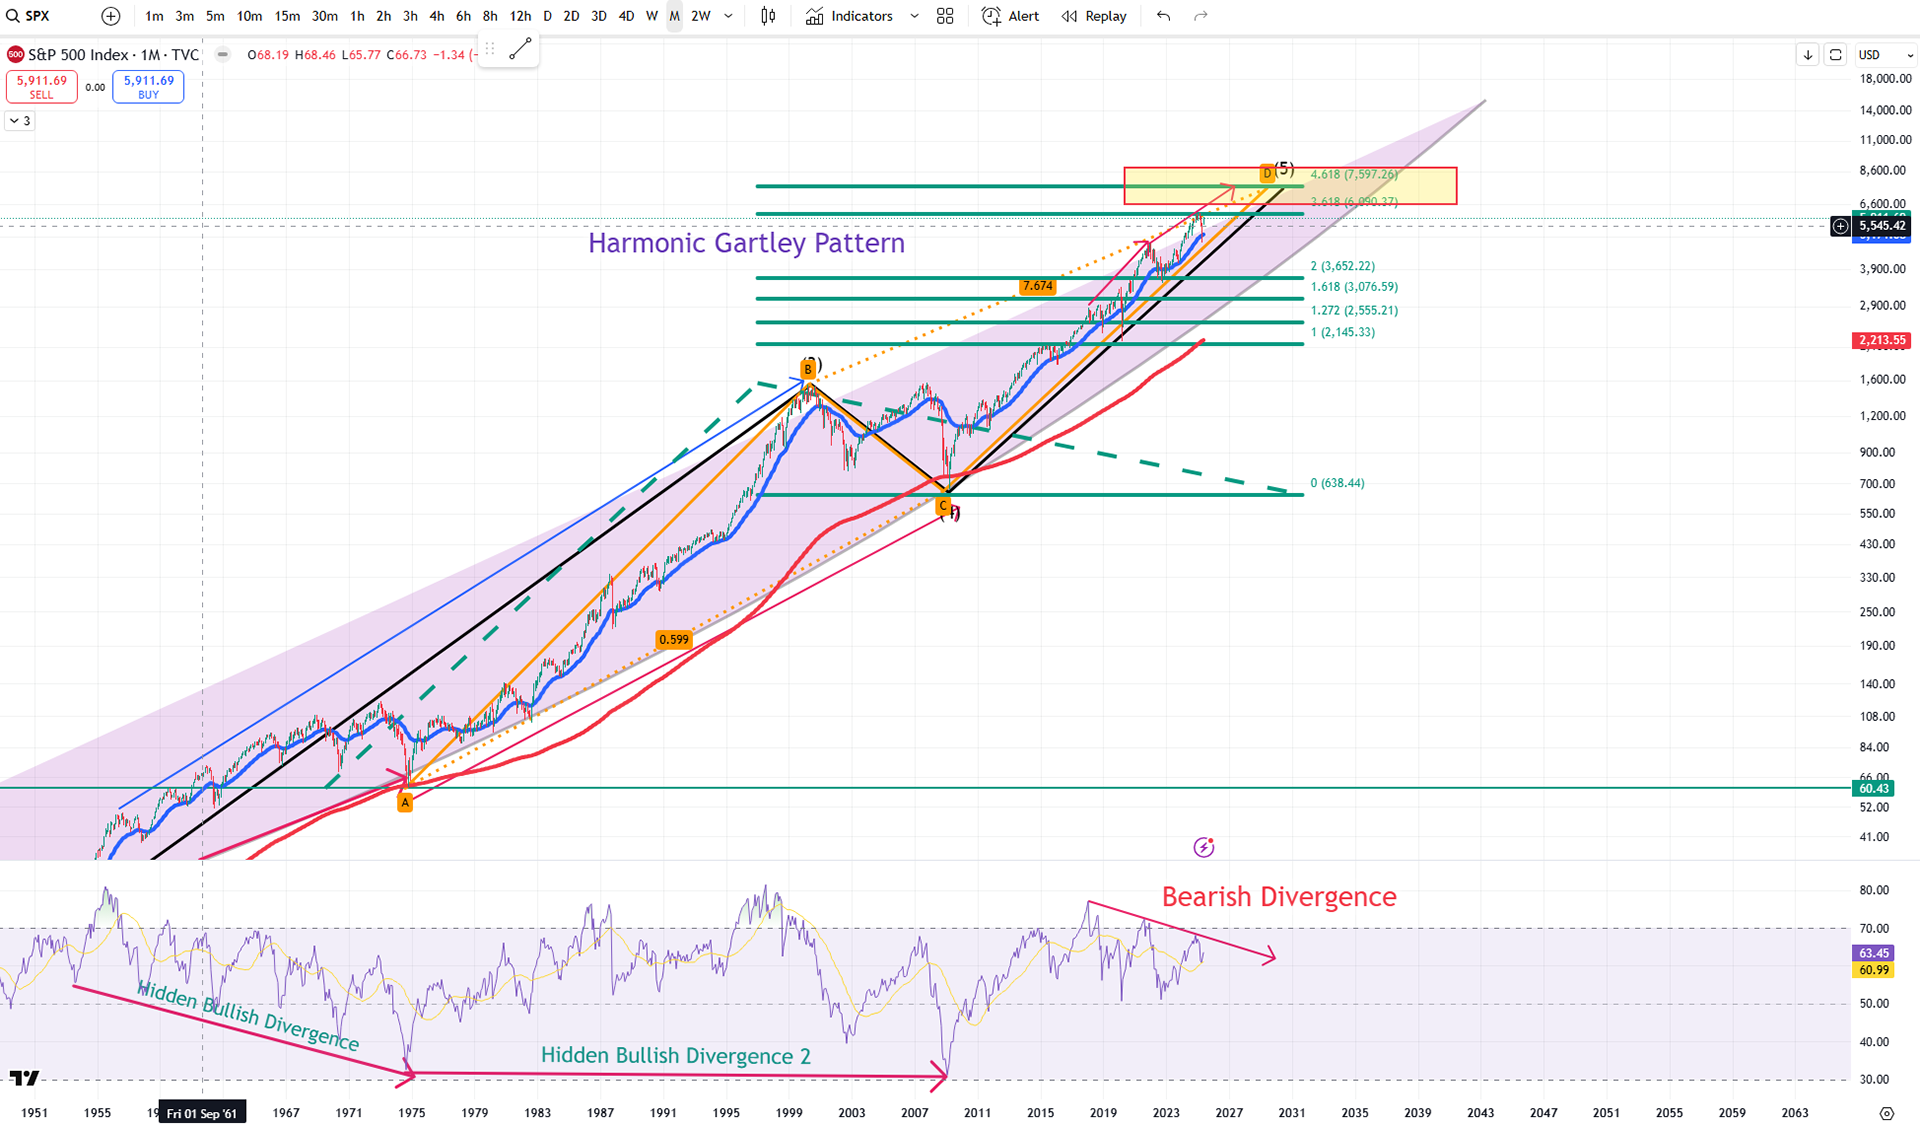
S&P500 Monthly Chart Analysis with Elliott Wave Theory, Harmonic Gartley Pattern, and Fibonacci Extension
# Overall Structure based on Elliott Impulse Wave in Progress
The S&P500 is currently unfolding a long-term Elliott Impulse Wave where wave 3 completed with a top near $60.43. A correction followed from wave 4 also coincides with Point C of a Bullish Gartley Pattern.
# Harmonic Pattern : Gartley Formation
1. AC retracement is close to 0.618, B is on 0.618
2.BD retracement approaches 0.786.
Using Fibonacci trend-based extension from Point A, the price action beginning from Point C($638.44) must exceed the 1.0 extension with the Potential Reversal Zone (PRZ) lying between 1.618 and 2.24 extensions. (Chart is below)
# Elliott Wave Confirmation with MA(200), EMA(30) in CD
The BC represented a classical wave 4 correction, while the CD is now unfolding as a wave 5 impulse. Also, Point A originated above the MA(200) that acted as firm support. Throughout the structure, the EMA(30) has remained above MA(200) so we can know there is a long-term bullish trend yet.
# Hidden Bullish Divergence & RSI(30) Insight
A hidden bullish divergence appeared on RSI(30) between the end of wave 2 and the start of Point A, and also between Point A and Point C. This reinforced the Point C as a strong buy zone that also supported by MA(200). Fibonacci trend-based extension from Point C indicated $2,145.33 as a secondary buy zone, where the price resumed its upward move after breaking above the Fibonacci 1.0
extension level.
extension level.
# Fibonacci Extension Targets & Price Action
The PRZ(1.618 ~ 2.24) was breached because the price broke above the 2.24 extension near $3,463, closing securely above that level after reclaiming the EMA(30). The index is now testing resistance near the 3.618 extension rate. Then, it is still within wave 5 of the impulse cycle.
# Next Key Resistance & Bearish Divergence Risk preparation
The price, $7,597.26, is new key resistance line because it projected Fibonacci extension of 4.618, aligned with RSI(30) potential overbought section, and matches the upper point of a bearish RSI divergence line drawn from extension from 1 to 2.24 and 3.618. This level would mark the final stage of Wave 5.
At this time, if RSI(30) is rejected around 66.36, you can see the clean bearish divergence structure.
At this time, if RSI(30) is rejected around 66.36, you can see the clean bearish divergence structure.
# Management Suggestion
Although bullish momentum and divergence remain active, the presence of multiple resistance confluences at $7,597.26 signals a higher probability of a topping pattern. Partial profit-taking (50%) is recommended around this zone because of the Fibonacci 4.618 trend extension, ongoing RSI bearish divergence in progress, and psychological and structural confluence.
Conclusion
The S&P500 Index appears to be in the final phase of wave 5. We can see a strong Gartley pattern and Fibonacci extension targets at the Monthly chart. The next resistance around $7,597.26 may offer a tactical sell zone due to progressing of bearish divergence risk, despite ongoing bullish structure.
Please watch RSI(30) around 66.36 and the Fibonacci 4.618 level closely for signs of exhaustion. You can see 1-W cycle below:
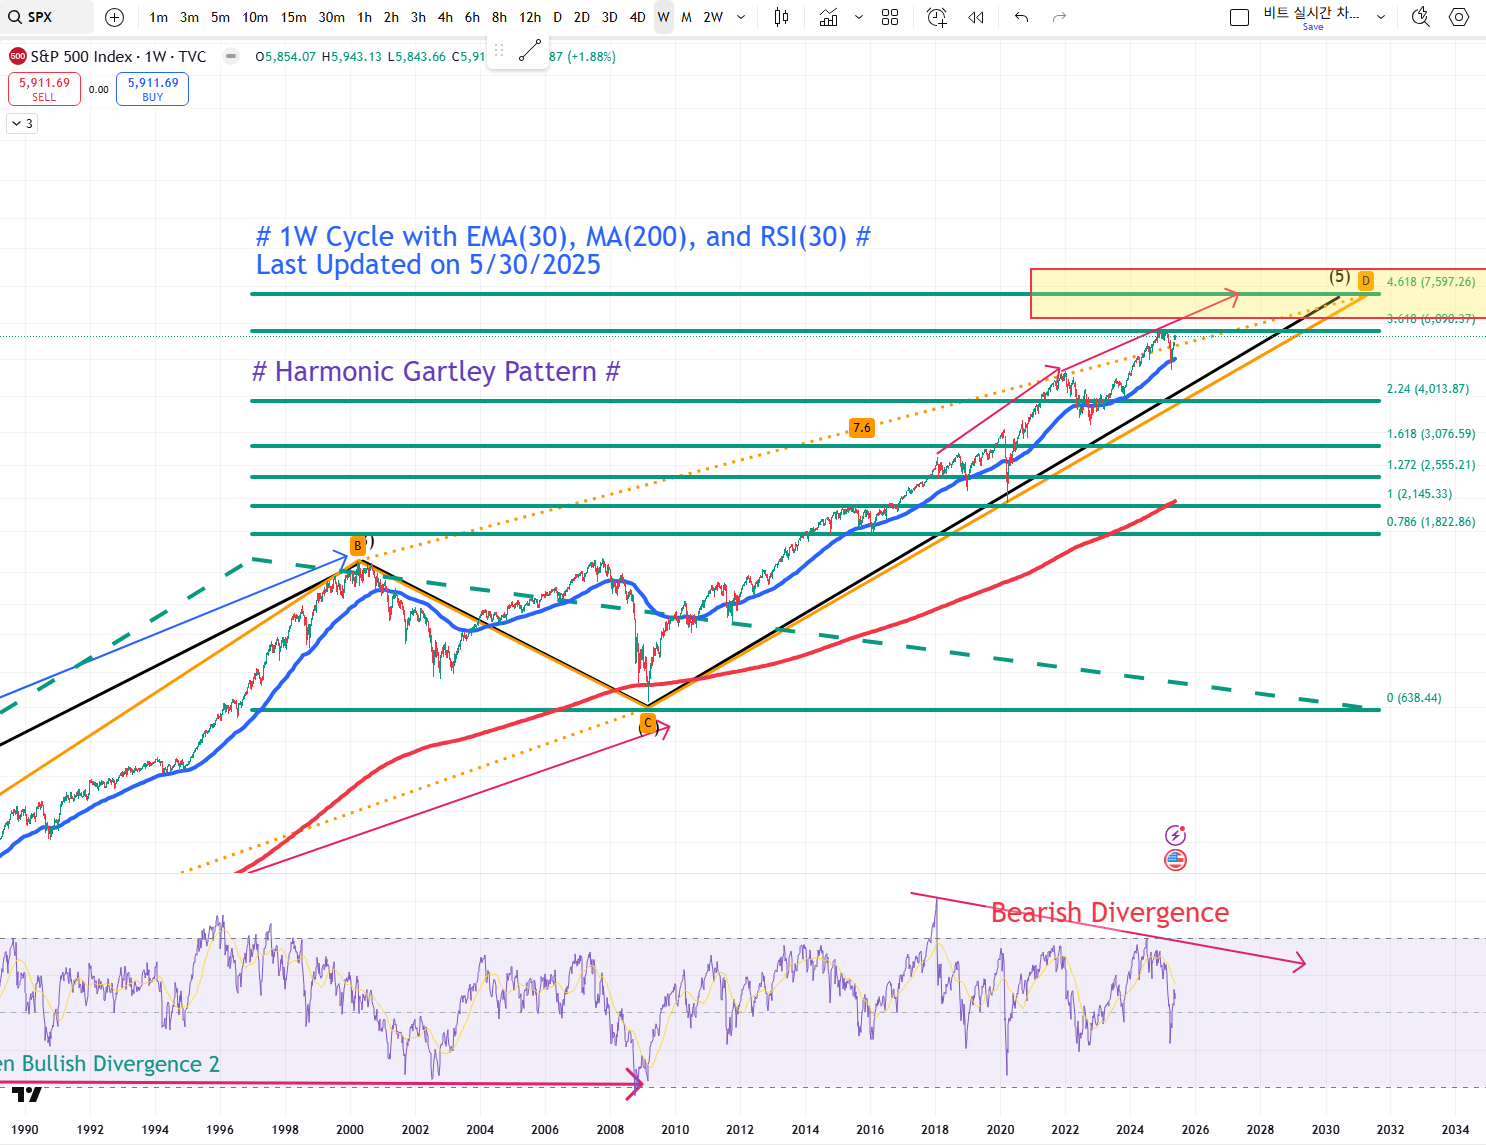
These are Macro Base Assets with Part 1 and Part2 for further Individual Stock Assets Analysis. Next, I will do Fundamental and Technical chart Analyses & Risk Management for Amazon.
Appreciate it!


