In this Macro Base Assets, there are six main assets that divided to two parts for price analysis and strategic interpretations across USD, Oil, Gold, Bitcoin, NASDAQ, and S&P 500. I will use RSI, Fibonacci Retracement, five Harmonic patterns impossible, and MA or EMA. This portfolio shows how I detect market structures, interpret key signals, and develop actionable outcomes across macro-assets and equity movements. From two parts of Macro Base Assets,
I would reflect how I think, not just what I see. In this Macro Base Assets Part 1, there are three main assets, for example, USD, Oil, and Gold.
## Macro Base Assets Part 1 : USD, Oil, and Gold ##
1. USD Index (DXY)
a. USD Index - Weekly Chart Analysis
Chart Source : TradingView (1W Interval)
Tool Used : EMA(20), MA(200), Fibonacci Retracement, Harmonic Bat Pattern, RSI(20), Volume
# DXY (Dollar Index) Interpretation and forecasting:
1. Harmonic Bat Pattern & Technical Outlook
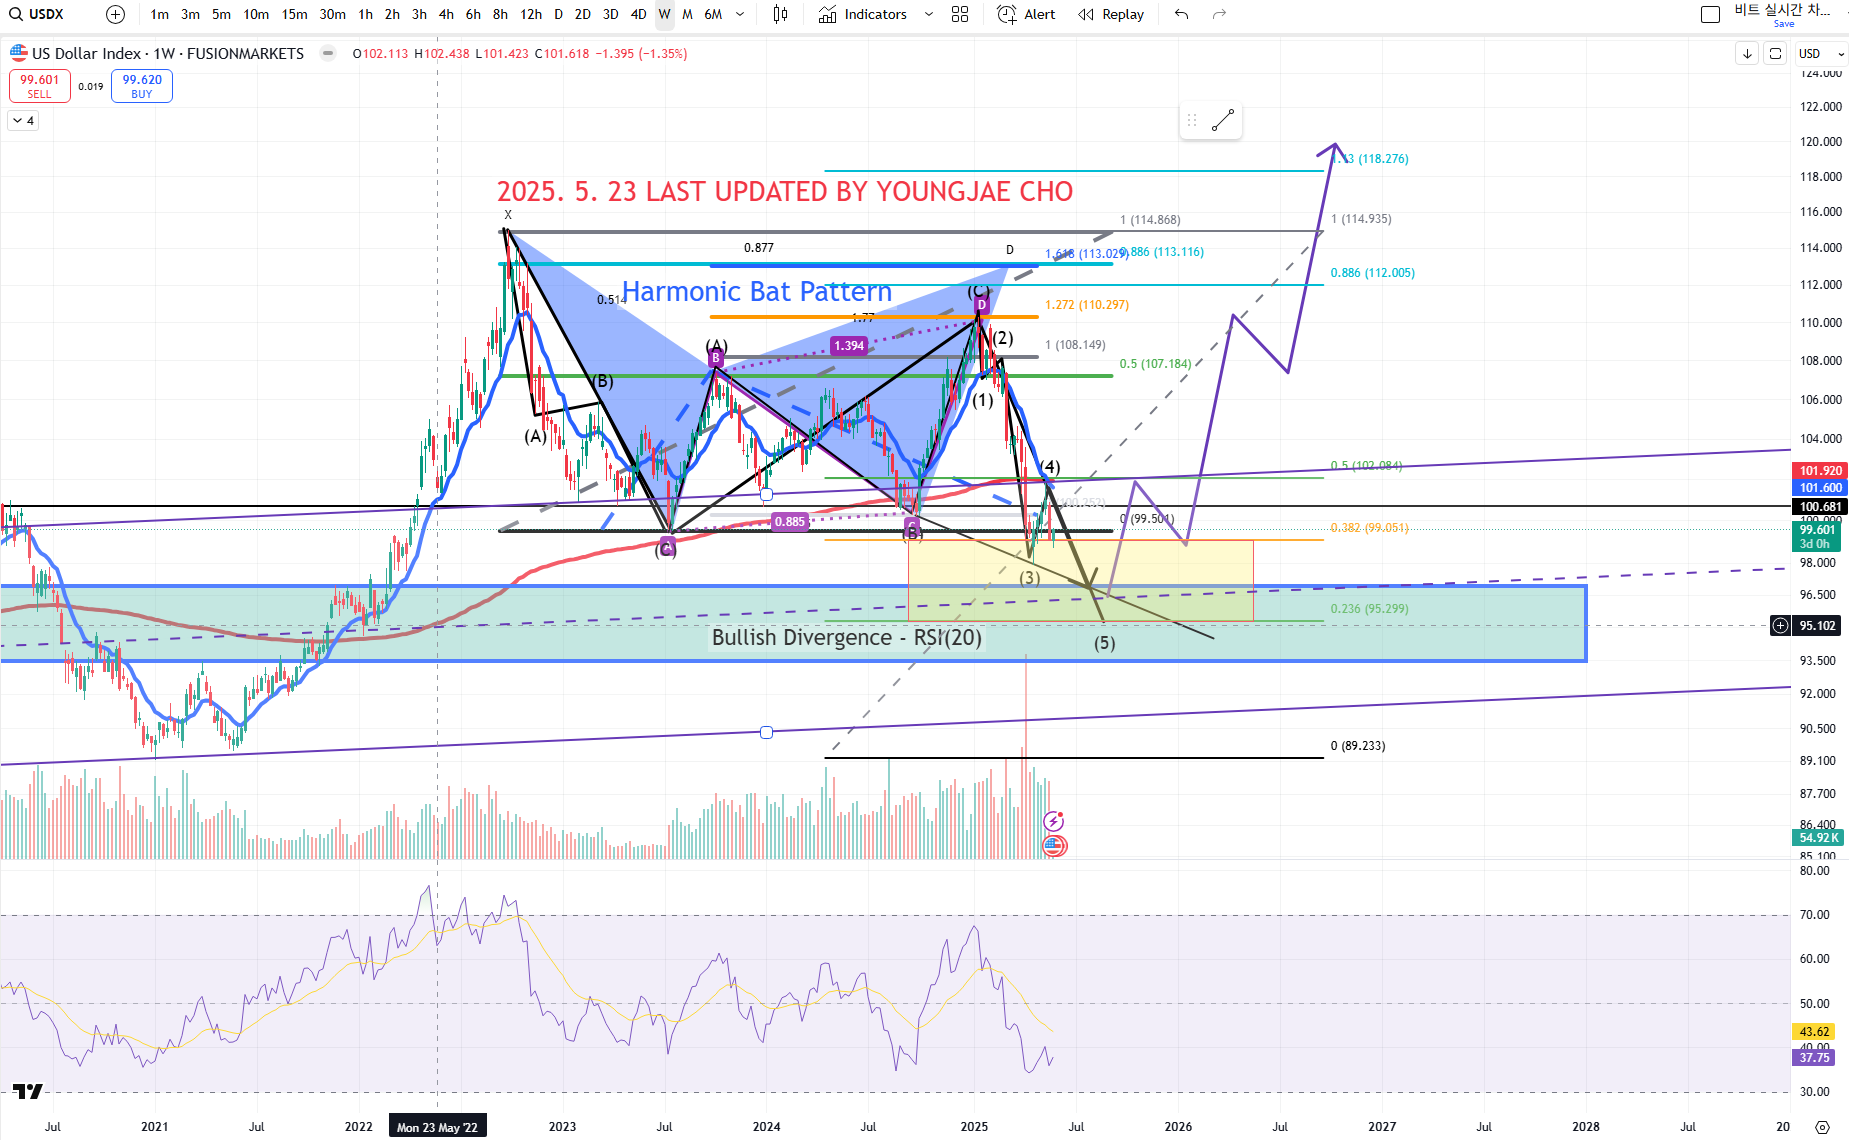
From a long-term weekly chart perspective, a harmonic Bat pattern appears to be forming based on the following structure:
• X : September 2022 high
• A : July 2023 rebound low
• B : October 2023 resistance, price was near the 0.5 Fibonacci retracement of XA in harmonic Bat pattern.
• C : September 2024 rebound area, where a hidden bullish divergence was detected on the RSI (length = 20)
• D : The price failed to break through the 0.886 retracement level, the minimum PRZ section. Before PRZ section, the price was stopped at the 1.272 Fibonacci extension of the ABC connection, around $110.297.
Currently, the price has dropped below point A that means that a strong reversal is unlikely in the short-term.
2. Ascending Channel Breakdown
When extending the trendline connecting from January 2018 low bound and the January 2021 low bound to the points, including the September 2019 high bound and the breakout seen after January 2021, we can see a clear purple ascending channel above.
However, after holding this channel for a prolonged period, the current price has broken below the purple high bound. This indicates that the candle stick would have a potential bearish continuation unless the price reclaims this zone.
A key inflection point lies between 99.6 and 102 US Dollars. Falling to reclaim this region suggests further downside risk remains.
A break back above would invalidate the bearish thesis and signal a new entry chance.
3. Moving Average & Exponential Moving Average with Bearish Crossover
The 200-day MA is currently aligning near 102 US Dollars, right at the old resistance zone and upper edge of the previous ascending channel. The 20-day EMA has recently crossed below the 200-day MA line. At this time, we can see the Dead-Cross signal.
4. Elliott 3-3-5 Correction Wave
The entire XABCD harmonic structure also resembles an Elliott 3-3-5 flat correction with the current wave structure possibly in the final leg of the fifth corrective wave. In a week candle, there were a hidden bullish divergence occurred during the AC section on RSI(20) and since a potential RSI bullish divergence between point C and the current prices may be conducted, then the downward momentum would be faded.
5. Fibonacci Retracement Zones & Volume evidence
If we connect the overall bull cycle low and high using a Fibonacci retracement, there could be two cases:
• a. Currently, the price is near the significant support zone of 0.382 that was important section at the past.
• b. Volume analysis suggests that prices recover after a sharp increase in sold volumes at recent lows that indicates that the possibility of the bottom.
Overall, these things support the idea that the reversal wave is coming to an end.
Conclusion
In conclusion, a harmonic Bat pattern has completed in the current chart, and the price reversed at a key 1.272 extension level. The current price declined Point A below and the ascending channel (purple channel) is concerning. The recovery $102 above is required to re=establish a bullish case. RSI Divergence, volume exhaustion, and Fibonacci support zones hint that the corrective phrase would be end.
If the close price fails to hold from 93.5 to 95 dollars, the next potential support line would be at the 0.236 Fibonacci retracement level. Further works would be updated.
If the close price fails to hold from 93.5 to 95 dollars, the next potential support line would be at the 0.236 Fibonacci retracement level. Further works would be updated.
2. Oil (CL1!)
a. Light Crude Oil Futures - Weekly Chart Analysis
Chart Source : TradingView (1W Interval)
Tool Used : EMA(20), MA(200), RSI(20), Volume, Fibonacci Retracement, Harmonic Shark Pattern
# Crude Oil Futures (CL1!) Interpretation and forecasting:
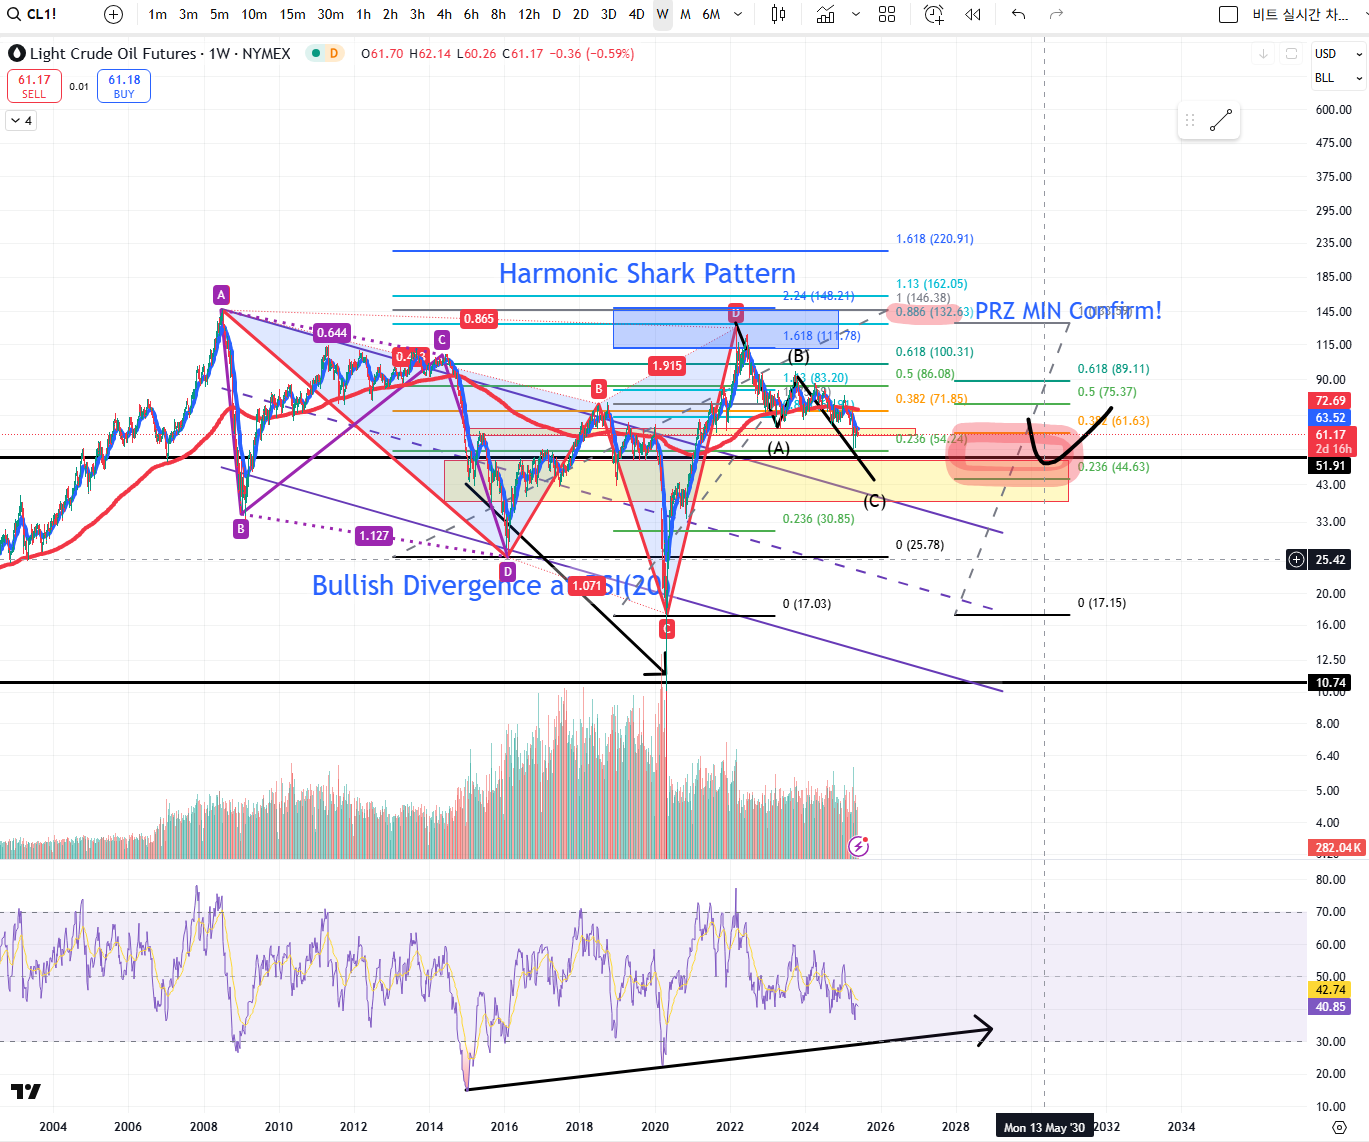
The current price is $61.19 at the supply-demand zone from $60 to $63.29. This zone has shown strong transactional volume in the past and serves as an immediate support cluster.
Harmonic Shark Pattern (XABCD or Cypher)
Upon analyzing the long-term structure, I observed that after forming a major high on July 28, 2008, the price appears to have completed a 1-2-3-4-5 Elliott impulse wave down for a long-term bearish cycle.
By drawing the harmonic XABCD structure from this major top, I identified that Point B occurred near the 0.382 Fibonacci retracement of XA. This shows that it is the Shark pattern that is a variant where Point C includes two lower bounds when a structure where C falls below A, increasing the Fibonacci extension range. After the correction wave, we can see the bottom was around $17 as Point C.
Plus, Point D forms at the Potential Reversal Zone (PRZ) around the 0.886 retracement of $132.63. Also, we could confirmed that Point D value located between 1.618 and 2.24 Fibonacci extensions of the CD section.
Following the completion of the Harmonic Shark Pattern, the market entered a corrective phase. Given that the XABC section was impulsive to the downside, and CD appears to be a sharp rally.
It is possible that we are not seeing an ABC reversal pattern from the top of point D.
It is possible that we are not seeing an ABC reversal pattern from the top of point D.
Key Support Zones and Fibonacci Confluence
• x. The ABC corrective structure is accompanied by RSI Bullish Divergence based on length 20.
• y. Connecting the RSI low bounds that formed divergence suggests that a potential next RSI touch at range 30 could serve as the next optimal entry point. Check out the price if the divergence has whether it is symmetry or not.
• y. Connecting the RSI low bounds that formed divergence suggests that a potential next RSI touch at range 30 could serve as the next optimal entry point. Check out the price if the divergence has whether it is symmetry or not.
MA & EMA
There was already confirmed Dead-Cross. (EMA < MA) And from a conservative risk-managed perspective, a potential long position might also be considered only after EMA (20) crosses back above the MA (200).
Conclusion
In conclusion, the harmonic shark pattern be completed and price is now undergoing a technical correction. The absence of RSI bearish divergence shows that the current movement is more likely corrective rather than the impulsive down. We should focus on two major buy zones to monitor for long positions:
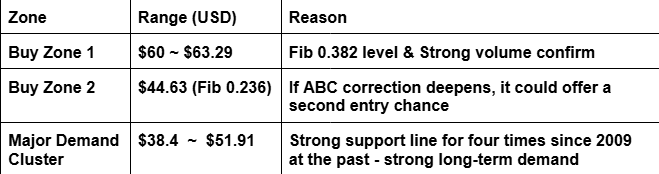
• 1. Primary buy zone ($60 ~ $63.29) : The current area + Fibonacci 0.382 level and key structure support.
• 2. Secondary buy zone ($38.4 ~ $51.91) : Volume cluster + 0.236 retracement + retest section for deeper demand.
If RSI holds a bullish divergence near the range 30 on the weekly close, and if a bullish reversal candlestick forms, this could validate a high probability long position setup.
*** The red-highlighted box on the chart marks the strongest accumulation zone. Confirmation would depend on whether weekly candles close above divergence-supporting RSI levels. ***
3. Gold (USD / OZ)
a. CFDs on Gold (US dollars / OZ) - Monthly Chart Analysis
Chart Source : TradingView (1M Interval)
Tool Used : EMA(20), MA(200), RSI(20), Fibonacci Retracement, Harmonic Shark, Gartley Patterns
# Gold (US Dollars / OZ) Interpretation and Forecasting:
Gold Monthly Chart using Harmonic Gartley Pattern & Channeling & RSI Momentum Analysis
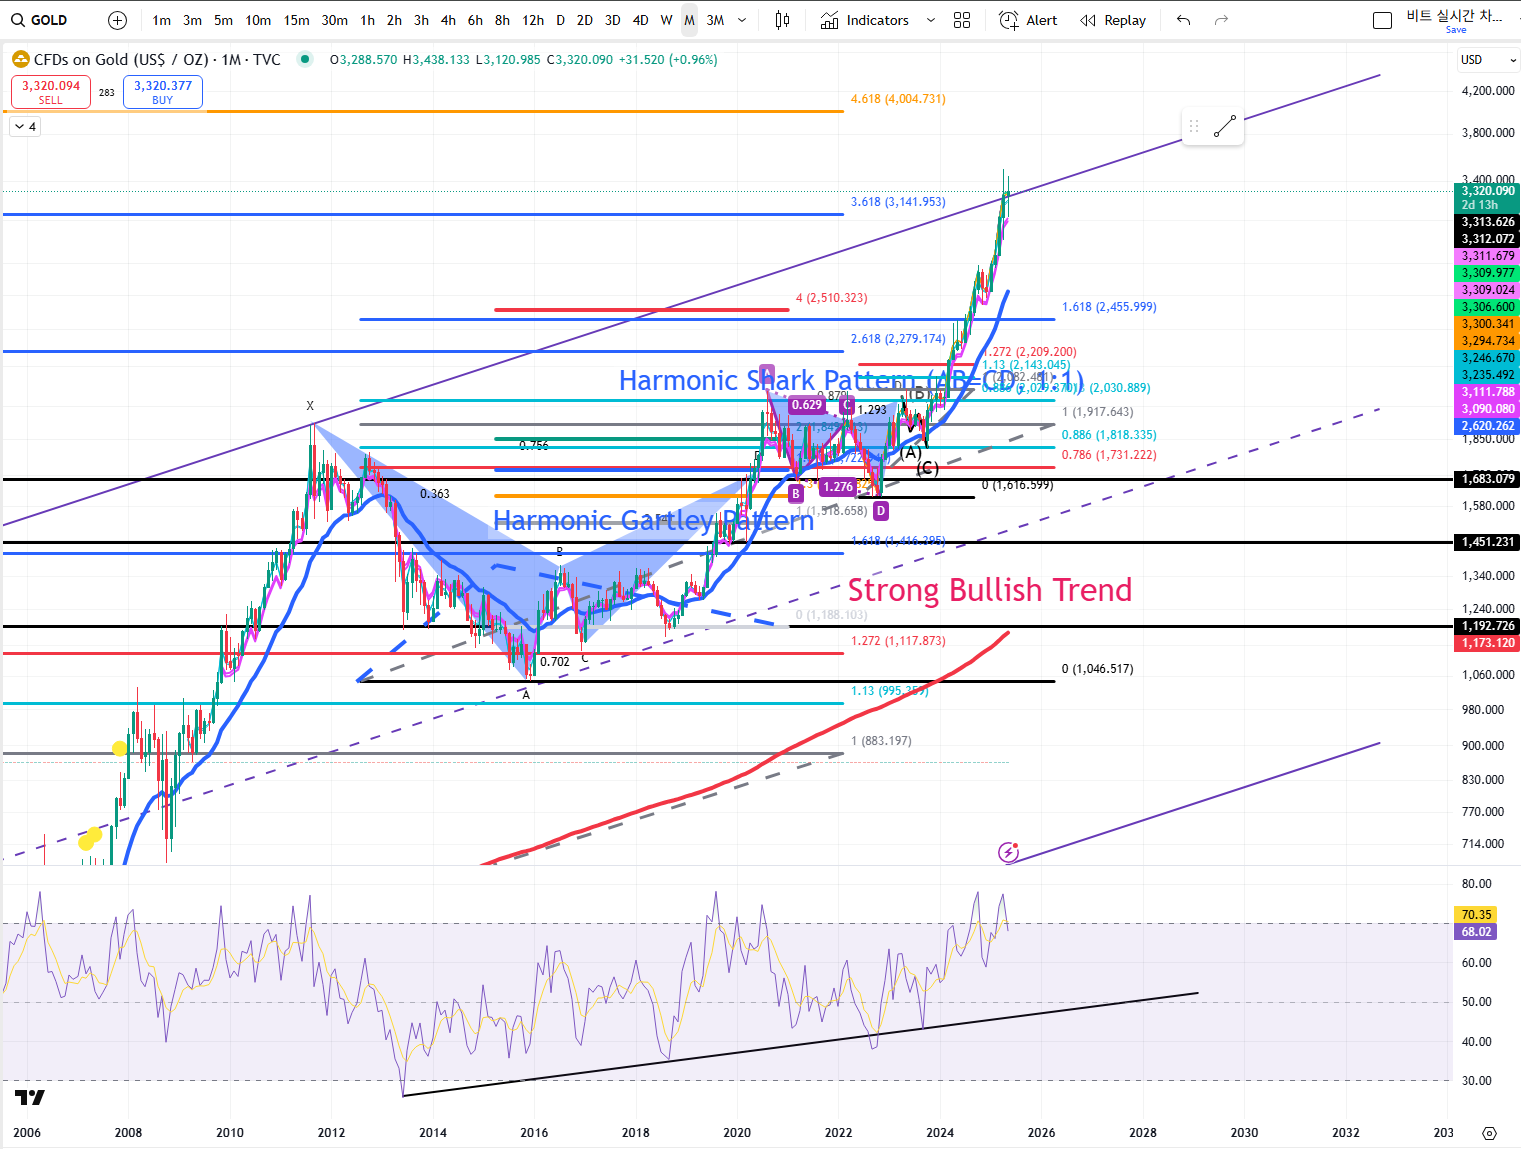
Gold price formed a significant top at $1,919.391 on August 1st, 2011, which initiated a clear impulse wave downward until December 1st, 2015. The price rebounded up to the $1,374 zone.
Upon analyzing the structure using harmonic principles:
• 1. Point B placed near the Fibonacci 0.382 retracement of XA. Confirmed the harmonic symmetry.
• 2. Point C settled at $1,149.386, rebounding precisely near the Fibonacci 0.886 retracement of AB section. We can see the flat correction.
• 3. This was followed by a strong impulse wave upward and reached out the minimum PRZ (Potential Reversal Zone) at the 0.786 retracement. Confirmed the harmonic Gartley pattern.
• 4. Next, there was a harmonic Shark pattern after harmonic Gartley pattern. Point C formed two successive lower bounds and fell below Point A.
• 5. XABC built a flat corrective structure.
• 6. Point D reached $2,029.37, at the Fibonacci 0.886 retracement level. (PRZ section)
After Point D, a short-term corrective pullback (ABC) conducted into the retracement zone of the CD section (around 0.5). The market price respected this zone and started a new strong impulse wave upward.
MA & EMA
EMA(20) is currently positioned above MA(200) on the monthly chart. This states that the market trend is a strong bullish trend continuation. Gold price is also traded within a long-term purple ascending
channel that began around December 1st, 1976.
channel that began around December 1st, 1976.
RSI & Long-term Divergence Insight
Since 1976, RSI(20) has shown significant hidden bullish divergence. From 1976 to 1999 and from January 2013 to December 2015, harmonic Gartley pattern was completed. The bullish divergence has remained intact to the present. If RSI(20) stays above range 47, it would effectively invalidate any lingering bearish divergence from three past tops.
Scenarios
• 1. Bullish continuation occurs when monthly close price above purple channel top line and then the target price would be $4,004. (upper projection)
• 2. Bearish starts when monthly close price below the purple channel resistance and there are two possibilities.
One possible case could be closed to EMA(20). Second one could be placed on the middle line of channeling.
Conclusion
In conclusion, gold price remains in an extremely strong long-term uptrend with extensions of harmonic Gartley and Shark patterns. The successful completion of the Shark pattern and bounce from the Fib 0.5 retracement of CD signals continued strength. As of now, the price is approaching $3,141 and is testing the top of the long-term purple ascending channel. If this level holds as support line, a continuation toward $4,004 would be possible. Monitoring the monthly close relative to the channel as well as RSI confirmation above 47 would be critical for validating the bullish outlook.