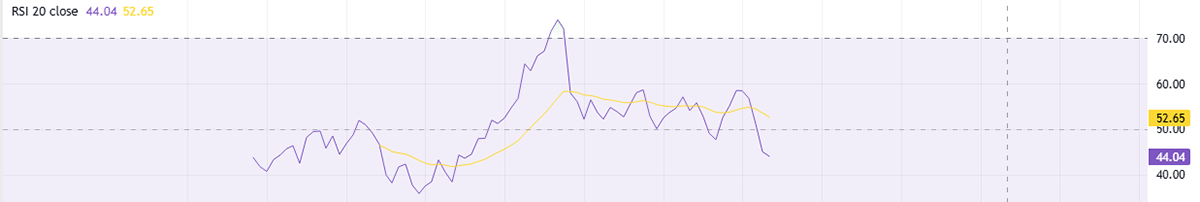
1. RSI (Relative Strength Index)
RSI is a momentum indicator that can measure the speed and change of price movements on a range from 0 to 100. However, in my case, the range is from 30 to 70. This range could be helped identify over-bought (>70) and over-sold (<30) conditions. I generally use RSI with length 20 to gauge medium-term momentum shifts at the support and resistance line for trend continuation or its reversals. This is an example of USDX using RSI(20) below:
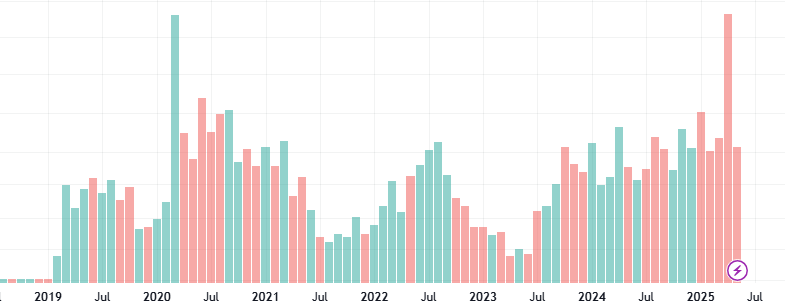
2. Volume
Volume shows the total number of traded contracts over a given time period. It is for the confirmation of price moves. The high volume validates strength of trend and the low volume shows weakness of trend. I typically look at how much a single volume affects the stock price and how the candle status has changed when looking at the volume on a chart. This is an example of USDX Volume below:
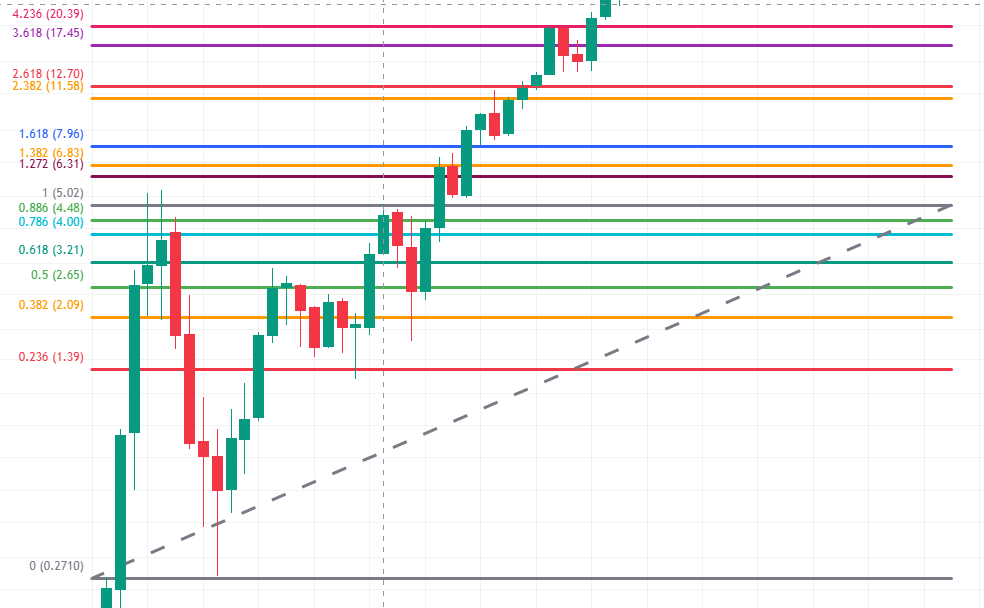
3. Fibonacci Retracement
A technical analysis tool, based on the Fibonacci sequence, is used to identify potential support and resistance levels.
There are three representative levels: 0.382, 0.5, 0.618.
These levels typically called golden section and the price may bound or reverse when it approach to them. I apply Fibonacci Retracement after strong impulse moves to find optimal retracement entries and identify some targets for trend continuation. In order to find a more accurate support level, sometimes 0.886 and 0.786 are the best places to be used as the standards during the correction wave retracement section. This is an example of AMZN stock price using Fibonacci Retracement below:
4. Five Harmonic Patterns
Harmonic patterns are geometric price structures based on Fibonacci ratios. There are the most popular five patterns, such as, Bat, Gartley, Butterfly, Crab, and Shark. They help forecast the potential reversal zones. I manually identify these patterns on TradingView and validate them with volume, RSI divergence, and price symmetry.
a. Harmonic Bat Pattern - Useful in trend continuation and forecast strong retracement
The instruction for Harmonic Bat Pattern for use is as follows:
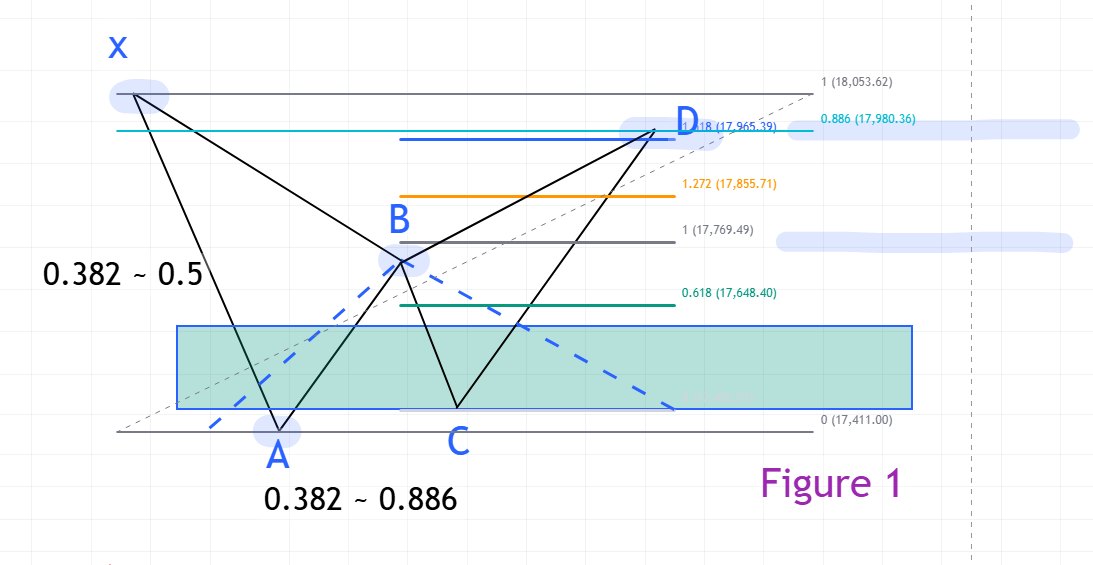
First off, the harmonic pattern, also known as XABCD, is typically referred to as XABCD Pattern for the following reasons. In corrective wave or reversal wave, when the Elliott wave theory's adjustment wave comes out as abc or abcde, the top is set to X, and when the rebound occurs after the adjustment wave is over, the starting point is set to A. We must set the Fibonacci return to measure the value B at the end of the rebound.
The area around 0.5 of the Fibonacci return interval that connects X and A becomes B. After that, whether or not the rise from A to B is an impulse rising wave, a rebound occurs, and a reversal wave is inevitable. After XAB, the rebound point becomes C, and the only way to find this is to have a C value between the Fibonacci values of 0.382 and 0.886 following A and B. Experience has shown that it usually reaches the vicinity of 0.886 in blue color below in Figure 1. The sky blue is the 0.886 section. The PRZ section is now required to look into, which is the Fibonacci section following X and A.
Personally, points C and D are the most important in bat pattern. Conservatively, it is impossible to carry a position from the lowest point to the highest when we go through the entire market. Therefore, if we have reached section B, which is the rebound section after section A, and are aware of it, point C will be a very good profit/loss ratio section. We also need to be aware of it because we need to know the point D to be able to across it. Another important thing in bat pattern is D, which is the point 0.886, but the length of the CD must exceed the B Close price. After that, the trend-based Fibonacci extension is used a lot in the ratio of 1.618, and 1.272, so a line is drawn from section AB to C. As shown in Figure 1, it is the section where 0.886 and 1.618 points, and usually the price between 1.272 and 1.618 would be the D point. It becomes the PRZ section but since 1.618 and 0.886 points are close with each other, this area can be a strong resistance section. I will deal with the harmonic BAMM (Bat Action Magnet Move) pattern more details later.
b. Harmonic Gartley Pattern - Use in stock and crypto markets
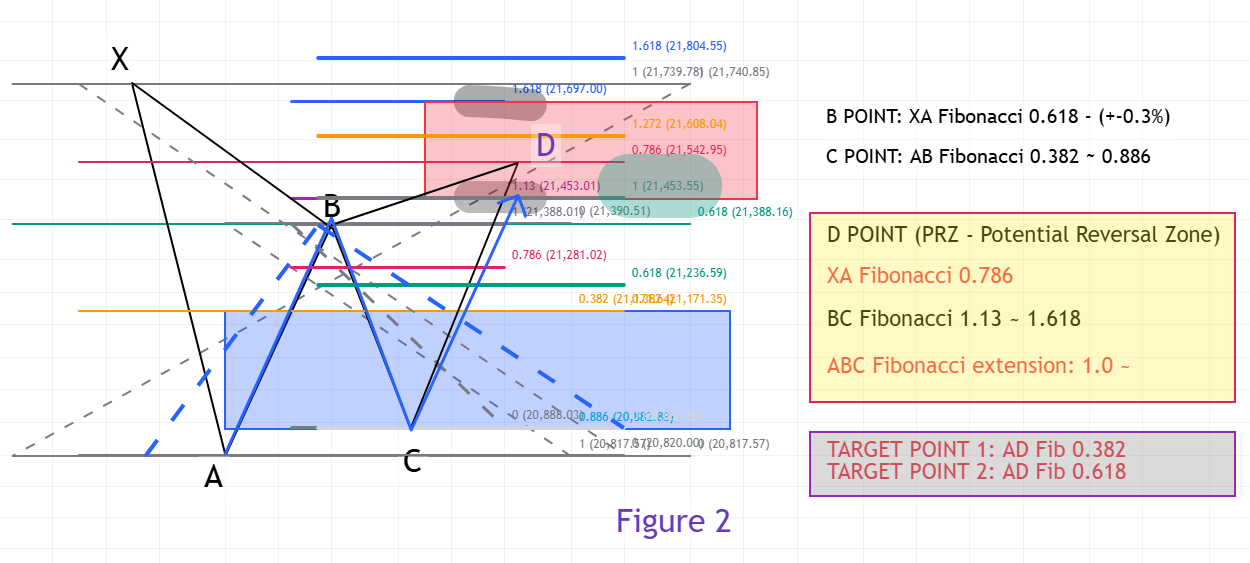
If points X and A are found, the point B used in the harmonic pattern is 0.618, which is the Fibonacci return interval between points X and A. In the bat pattern described at the Figure 1, B was between 0.382 and 0.5. However, in the Gartley pattern, section B is defined as the point 0.618. After that, finding point C should be between 0.382 and 0.886, the same as the bat pattern.
It rebounded from section 20,882.88 at the Figure 2, which is the 0.886 section, and the D (PRZ) section becomes the 0.786 point through the XA Fibonacci return interval. The PRZ section will be between 1.13 and 1.618 Fibonacci after B and C. The XA Fibonacci return value of 0.786 should, of course, be between 1.13 and 1.618.
The most significant Fibonacci extension function in the Gartley pattern is used to start with A, pass around the top B, and start with C, then the point 21,453.55 around 1.
Note the blue line.
As a result, the minimum PRZ section should be 21,542.95 line of 0.786. Therefore, point D should reach up to 0.786. I will explain more about the instruction how to use this function below:
c. Harmonic Butterfly Pattern - Used in Stock and Crypto Markets
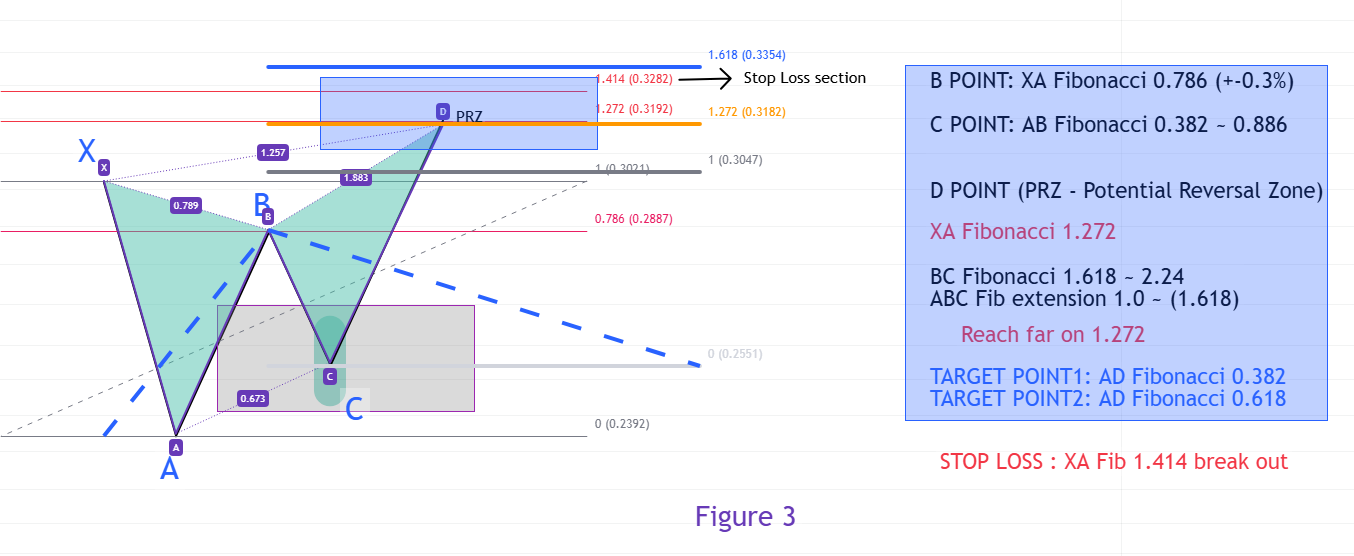
Point B, where the rebound after XA, is at point 0.786 of XA Fibonacci return. It is located near $0.2887. (Figure 3) The point where C will be located between 0.382 and 0.886 of the wave that is coming down like others. Point C can be seen by looking at the light pink box below. The next point D is 1.272, the Fibonacci extension that breaks out the value of X, and is also the PRZ area. The index finger is near the STOP/LOSS when it is near $0.3282. Harmonic Butterfly Pattern mainly has D exceeding the value of X. If the point D is below the X point, this is the stop/loss line. At the point D, the entry point uses a strategy to enter when an inversion signal is detected by referring to the RSI Divergence. Target Point 1 will be 0.382 in the AD section and Target Point 2 will be 0.618 in the AD section.
Through this strategy, risk can be managed and profits could be maximized. The Harmonic Butterfly Pattern is a suitable pattern in the stock and virtual currency markets, and it is highly likely that the entry signal will come before a strong trend change occurs. The time frame in the stock market was mainly more than 1 hour stick and reliable at daily and weekly candles.
Through this strategy, risk can be managed and profits could be maximized. The Harmonic Butterfly Pattern is a suitable pattern in the stock and virtual currency markets, and it is highly likely that the entry signal will come before a strong trend change occurs. The time frame in the stock market was mainly more than 1 hour stick and reliable at daily and weekly candles.
d. Harmonic Crab Pattern
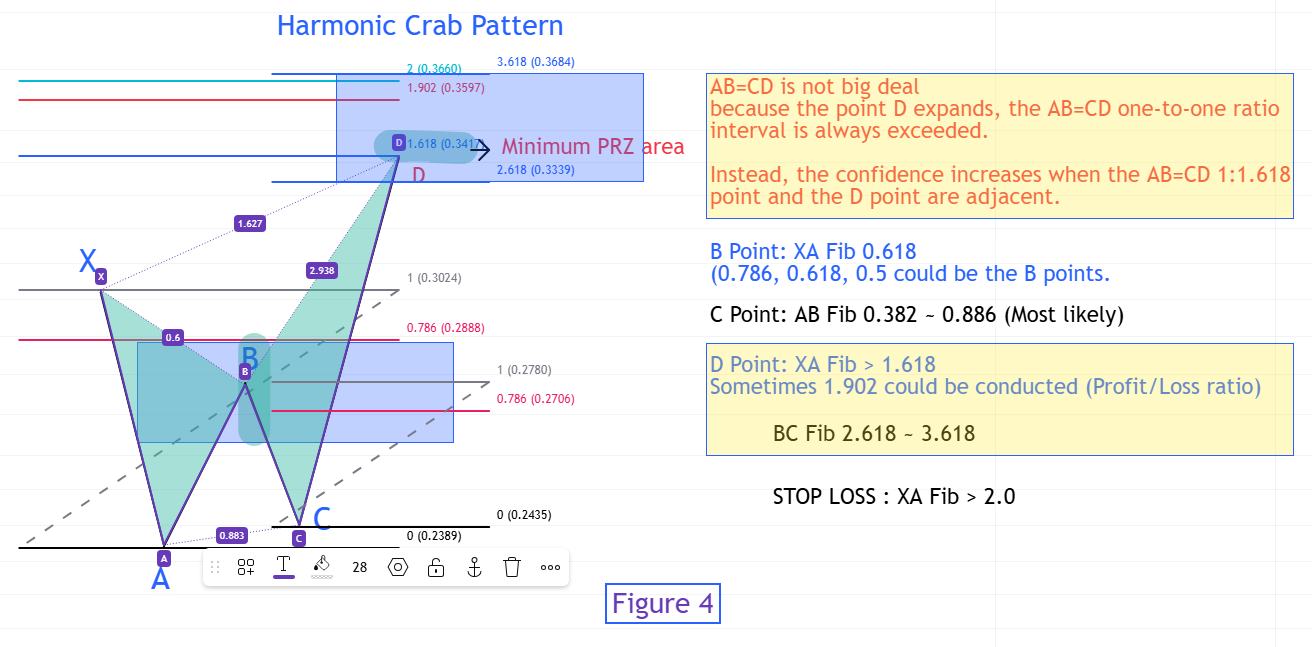
The section in which XA is completed and becomes B, whether there is an impact or adjustment wave, is the section in which XA is completed and becomes XA Fibonacci 0.618 section. However, be careful because the Crab pattern can be measured endlessly between 0.382 and 0.786, so even if a bat or Gartley pattern is found at 0.786, it can develop into a Crab pattern. The section in Fibonacci 0.618 is B in general, and the section in C, like other patterns, should be between AB Fibonacci 0.382 and 0.886. It does not matter if the stock price sometimes goes below 0.886, as long as it does not go below A. Assuming that C starts near 0.886 and D section can also reach the minimum PRZ area 1.618 and often 1.902, and the STOP/LOSS section is near 2.o.
Furthermore, the BC projection can be located between 2.618 and 3.618. When using the ABC Fibonacci extension, the 1:1 section, which is the most basic of harmonic pattern, is the minimum value, and in the Crab pattern, the D point following ABC is greatly expanded, so 1:1 is always exceeded, so if the AB=CD 1:1.618 point and the D (PRZ) point are adjacent, the reliability can increase.
Therefore, we can take advantage of the profit and loss section while reducing the risk. Conservatively, it is better to realize profits from TP1 and TP2. There is no correct answer to the chart analysis but through selection and concentration, we have to pay the price. (See Figure 4)
Therefore, we can take advantage of the profit and loss section while reducing the risk. Conservatively, it is better to realize profits from TP1 and TP2. There is no correct answer to the chart analysis but through selection and concentration, we have to pay the price. (See Figure 4)
e. Harmonic Shark Pattern
For the shark pattern, it is different from other harmonic patterns. The A and C points are either composed of twin peaks or twin bottoms. For the shark pattern, the C point is exceptionally lower than the A point.
Also, the tolerance is wide, so it can be found anywhere, so we have to look at everything from 0.382 to 0.618 points. Like the crab pattern, the range is quite wide.
In addition, if the B point is located between 0.382 and 0.618, it is also similar to the harmonic bat pattern, so we should be careful to deal with. Using the AB Fibonacci reversion, the 1.13 and 1.618 points will be near C, and the two low points mentioned above will take place. Here, the D point is divided into two cases where the PRZ is divided into two cases: First one is around 0.886 and the second is around 1.13. The area around Fibonacci 1.272 is the STOP/LOSS section, the area around 0.886 is the first PRZ section, and this area should be between 1.618 and 2.25, with the BC Fibonacci expansion value between 1.618 and 2.24. If the resistance comes out at 0.886, it cannot be helped, but for the shark pattern, we need to find D as the XC Fibonacci extension.
In addition to the harmonic pattern, there is a cypher pattern that can come out of this. Through this pattern, the D value can be accurately predicted. However, it is better to stick to the XABCD pattern since the C point measurement of the cypher pattern is different from the shark pattern. We will not deal with the cypher pattern here. Below is that we explain the harmonic shark pattern with the crypto-currency, Ethereum, chart from TradingView.
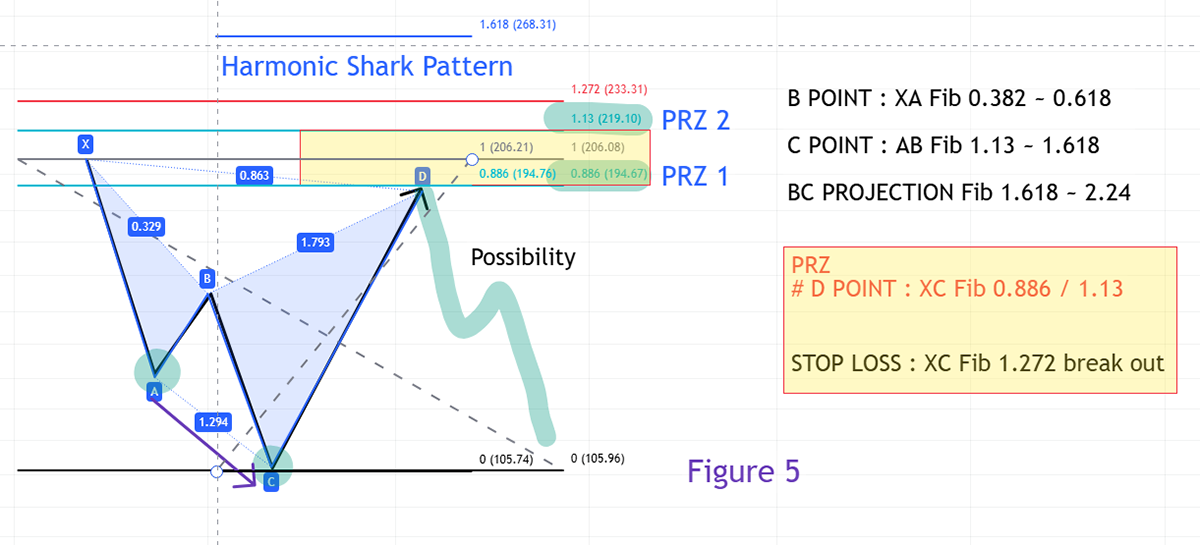
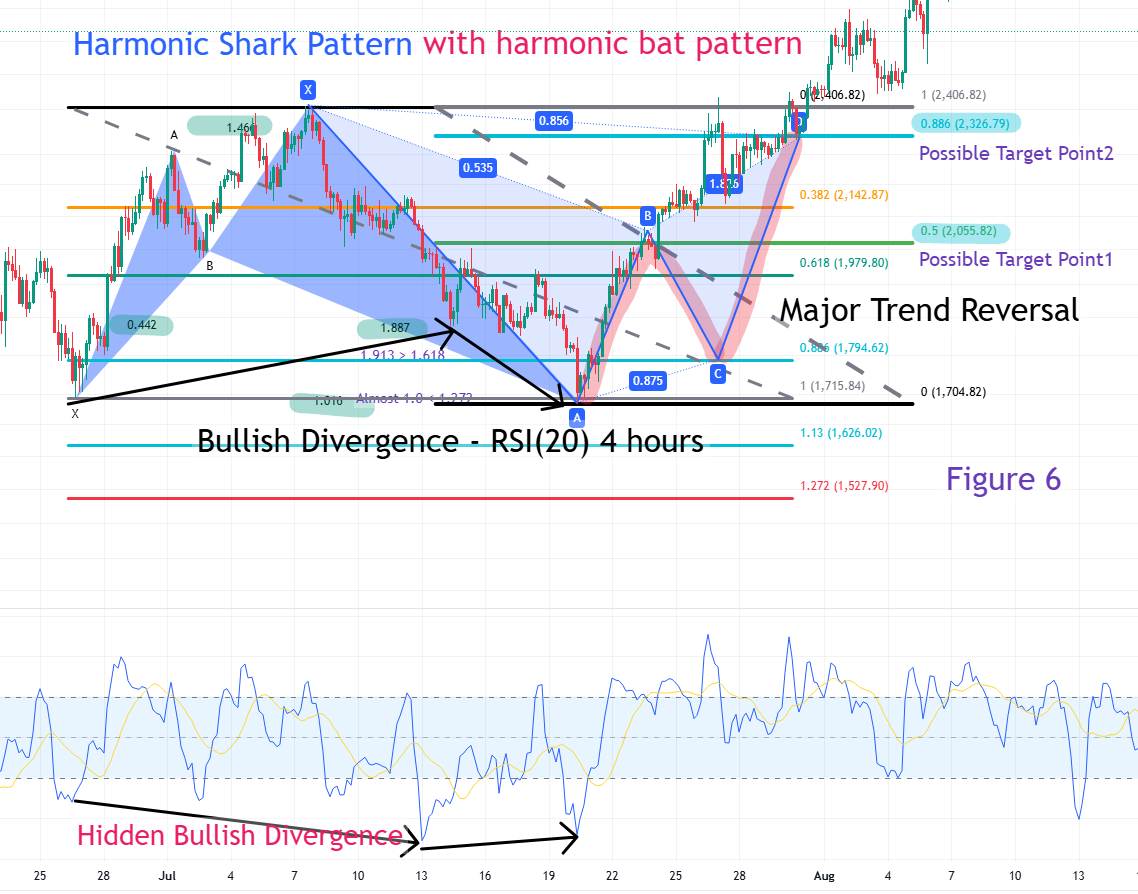
Figure 6 is using a harmonic shark pattern with harmonic bat pattern as an application version. Left is harmonic shark pattern and right one is harmonic bat pattern. We can see that Fibonacci ratios were confirmed. Also, by utilizing the harmonic bat pattern, the target point 1 would be o.5 Fibonacci ratio at XA, and the target point 2 would be 0.886 Fibonacci ratio at XA. Furthermore, A is considered the end of the adjustment wave and a trend reversal has occurred because it shows a very strong trend reversal, and the bullish divergence was confirmed at the XA point starting with the hidden bullish divergence in the harmonic shark pattern in the 4-hour candle through RSI with length 20. 0.5 would have been burnt if the CD Fibonacci 0.5 section was suppressed, and if it came down due to resistance, the CD Fibonacci extension of 0.886 would be the target price 2. Details are as follows:
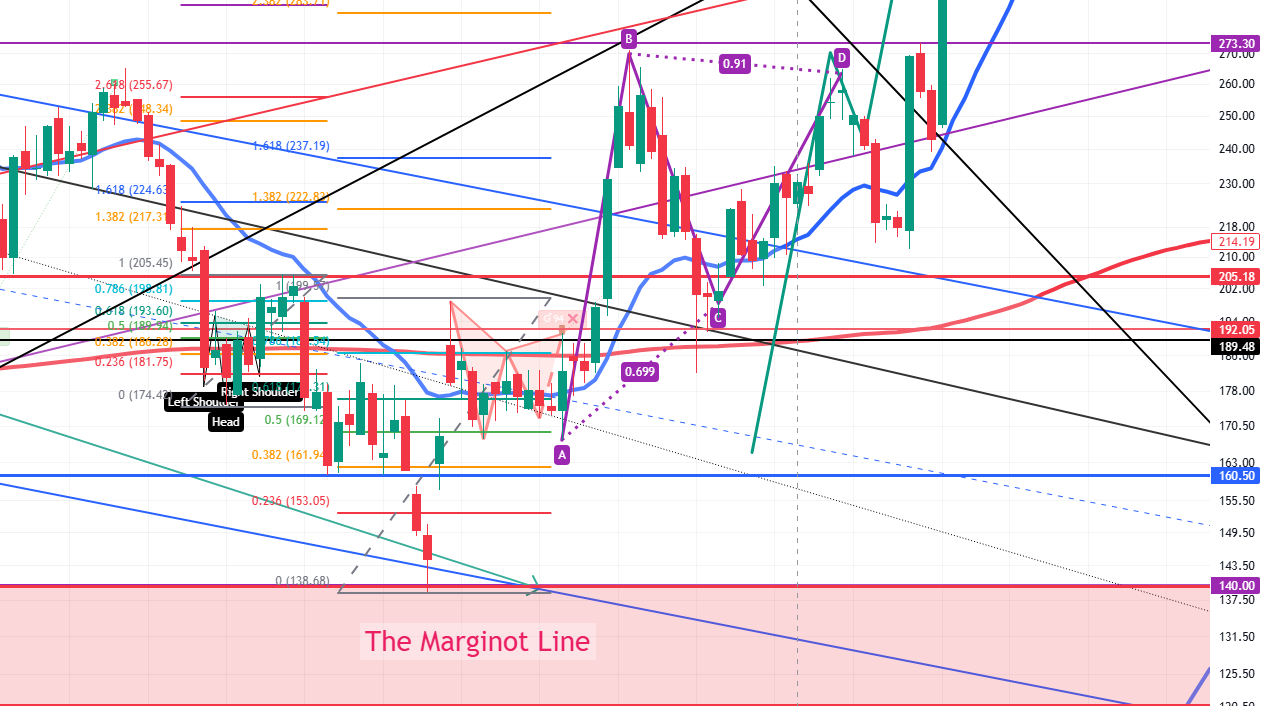
5. MA and EMA Indicators
MA, the Simple Moving Average, the red line and EMA, the Exponential Moving Average, the blue line in Figure 7. MA is the average of the closing prices over the last 200 candles because of its 3-day candles. It shows the general trend direction and reacts slower to price movements. On the other hand, EMA is also averages the last 20 closing prices but gives more weight to recent prices. Its purpose is more sensitive to recent price action. This means that EMA reacts faster than MA indicator. All of these are indicators used for technical analysis, but EMA is more often used than Moving Average Indicator.
EMA is more useful for dynamic support and resistance for crossovers. MA is also useful to identify the support and resistance but it is good at long-term period. However, in case of EMA, it demonstrates early signs of a trend change. This is because when it comes to investment, when the EMA 20 short-term moving average, such as the MA 50-day line or MA 200-day line, is the "Golden-Cross", when the EMA 20 breaks from the bottom to the top, it shows a strong upward signal. On the contrary, when the EMA line from the top to the bottom, a falling signal is built, which is called a "Dead Cross."
Currently, Golden-Cross occurred and rebounded because the EMA with length 20 crossed the MA with length 200 at the below Tesla Stock Price. When such a strong trend reversal occurs, the EMA in the future price can generate revenue. A look below exhibits that the price has risen when it is above the EMA.