Below is a R-Markdown pdf file for Risk Modeling in Amazon (AMZN) using VaR & Monte Carlo Simulation
(Daily ~ Weekly ~ Monthly cycles).
Under the report, you can see the results and conclusion from 1-day, 5-day, 21-day VaRs and Monte Carlo results.
(Daily ~ Weekly ~ Monthly cycles).
Under the report, you can see the results and conclusion from 1-day, 5-day, 21-day VaRs and Monte Carlo results.
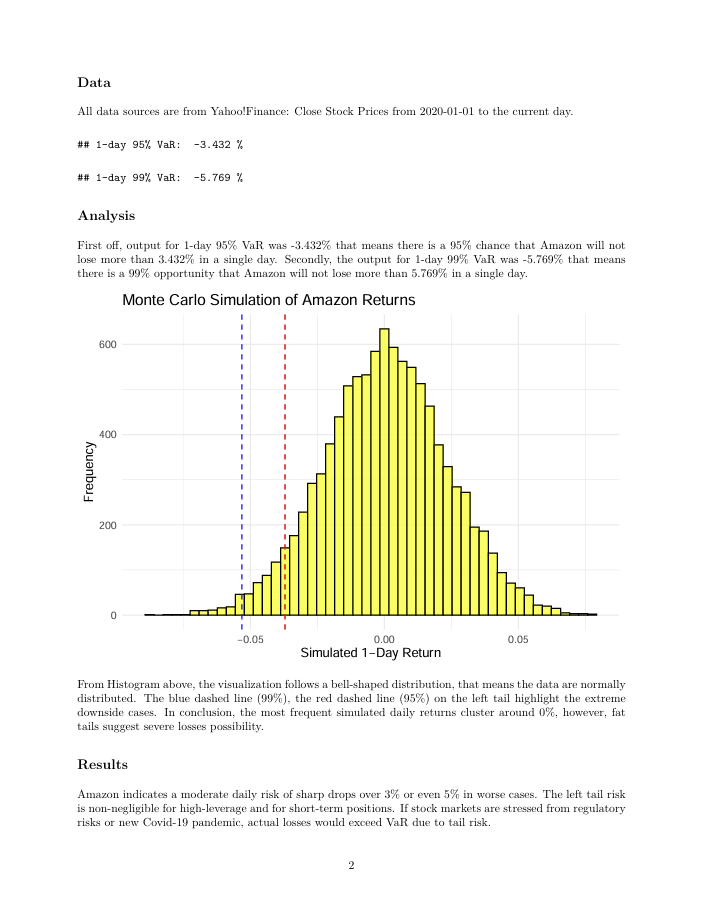
Daily Risk Analysis
There is a 95% chance that Amazon will not lose more than 3.432% in a single day and a 99% chance it won't lose more than 5.769%. From Monte Carlo Simulation, daily returns are normally distributed and centered near zero, however, it exhibits fat tails. Therefore, this implies the presence of extreme loss.
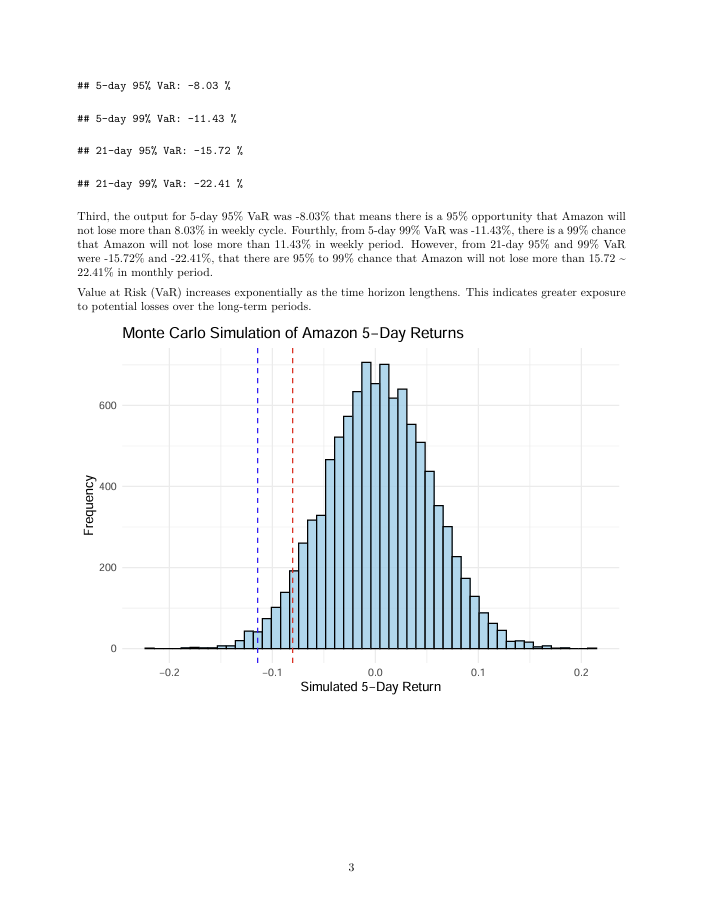
Weekly Risk Analysis
Over a 5-Day period, there is a 5% opportunity that Amazon could lose more than 8.03% and a 1% chance it could lose more than 11.43%. From Monte Carlo Simulation, the risk over the week is higher than daily. This demonstrates broader dispersion of returns and more downside volatility.
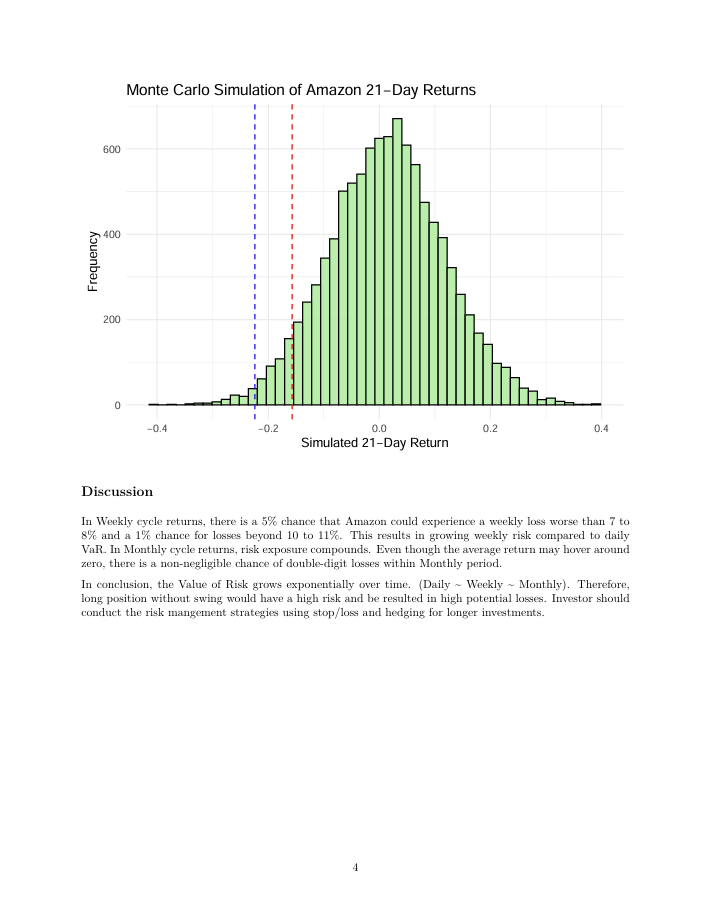
Monthly Risk Analysis
Over a monthly cycle, Amazon may lose more than 15.72% in 95% confidence level or more than 22.41% in 99% confidence level in extreme scenarios. From Monte Carlo Simulation, distribution is wider and more skewed and this shows risk. Long-term investors would face significant potential drawdowns.
Conclusion
The VaR increases exponentially over time, for example, 1-day, 5-day, and 21-day. To sum up, long position has a higher risk for long-term period. The solution for preventing portfolio loss would be used for stop/loss or hedging options in Amazon.