🎨 Amazon Corp. with Fundamental Analysis
1. Overview
Asset : Amazon (AMZN / USD)
Sector : Consumer Discretionary / E-commerce / Cloud Computing
Exchange : NASDAQ (USD-based)
Focus : Integrated Technical Analysis and Fundamental Analysis for investment insight
2. Fundamental Analysis - Financial Statements (sources from Yahoo-Finance)
A. Balance Sheet Review (21 ~ 24 annually)
✅ Total Assets, Liabilities, and Equity Structure
→ Total Assets (2024) : $624.89B
Up from $527.85B in 2023 and $46.68B in 2022 → About +18% YoY growth
→ Total Liabilities: $338.924B
Also increasing but at a slower rate than total assets → positive sign
→ Total Equity: $285.97B
Strong equity growth from $201.88B in 2023 → About +41.6% YoY
# Interpretation : Amazon is steadily building its asset base and equity growth is outpacing liabilities. These things suggest solid reinvestment and good long-term solvency strength.
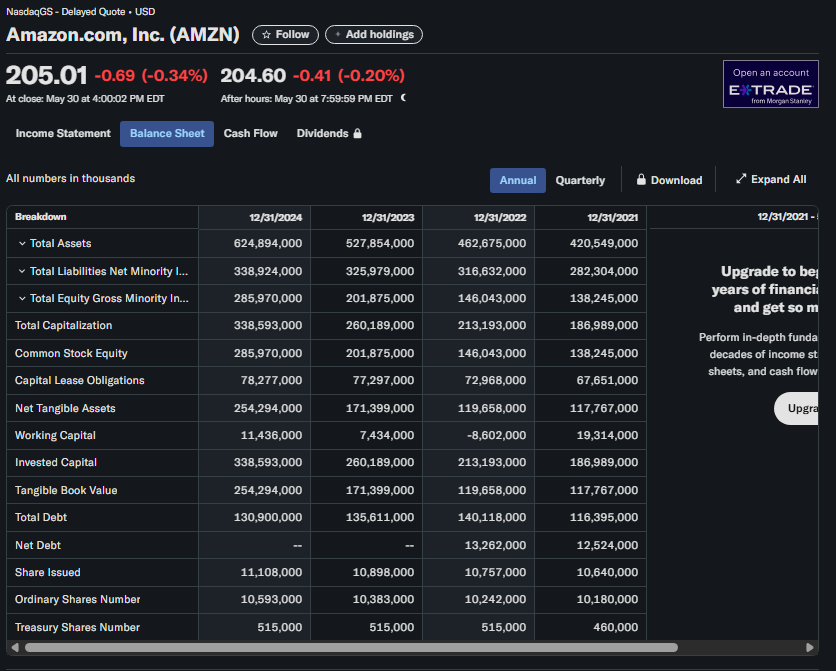
✅ Liquidity
→ Working Capital(2024) : $11.436B
Negative in 2022 but Improved from $7.434B in 2023 and from $11.436B in 2024.
→ Current Ratio Estimate
Working Capital is positive, so short-term liquidity has improved and risk has reduced.
✅ Total Debt with Equity Ratio
→ Total Debt (2024) : $130.9B
→ Equity (2024) : $285.97B
→ Debt to Equity = 0.456
# Conclusion : Amazon's balance sheet is strong with manageable leverage and improved liquidity as well as healthy asset and equity growth trends.
A2. Balance Sheet Review (Q1 2024 ~ Q1 2025)
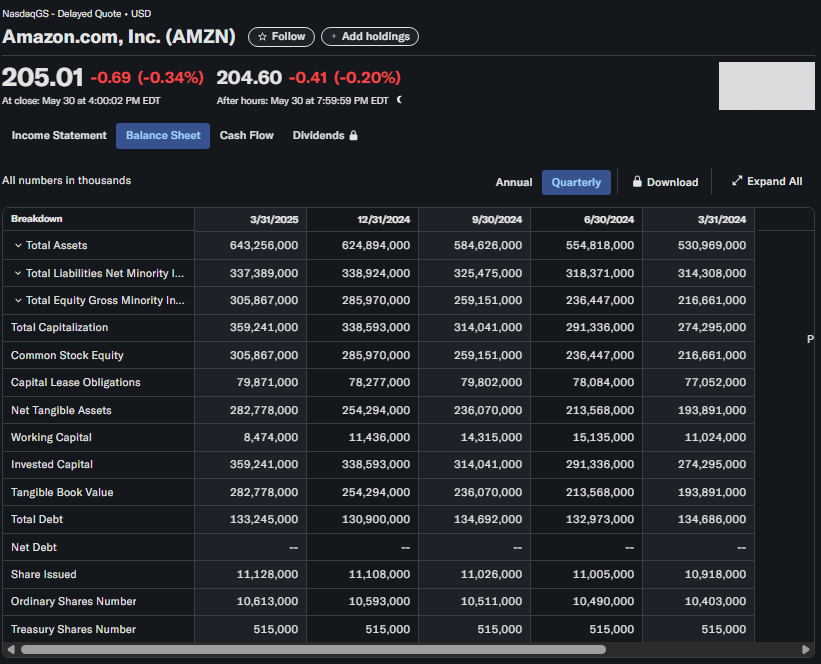
✅1. Balance Sheet Expansion
→ Total Assets grew from $530.969B to $643.256B (+21.1 % in one year)
→ Total Equity surged from $216.661B to $305.867B (Strong capital accumulation)
→ Total Liabilities stayed relatively stable (Gradually increasing)
# Insight : Amazon is aggressively growing while strengthening its equity base for long-term sustainability.
✅2. Debt Management
→ Total Debt remained stable between $130B and $135B throughout the year.
→ Despite rising equity, Amazon did not leverage more debt. Therefore, they maintained financial prudence.
# Conclusion : This led to a decreasing Debt to Equity ratio → Enhance credibility.
✅3. Working Capital Pressure
→ Working Capital peaked in Q2 ($15.135B) but declined to $8.474B in Q1 2025.
This indicates seasonal inventory increases.
✅4. Tangible Book Value Growth
→ From $193.891B to $282.778B in one year (+45.8%)
This shows that growing asset is not rely on goodwill or intangibles.
Conclusion
Amazon's balance sheet demonstrates strong growth with controlled leverage and improved equity. There was no sign of over-leveraging. But, Working capital decline at inventory and accounts payable or receivable should be tracked further.
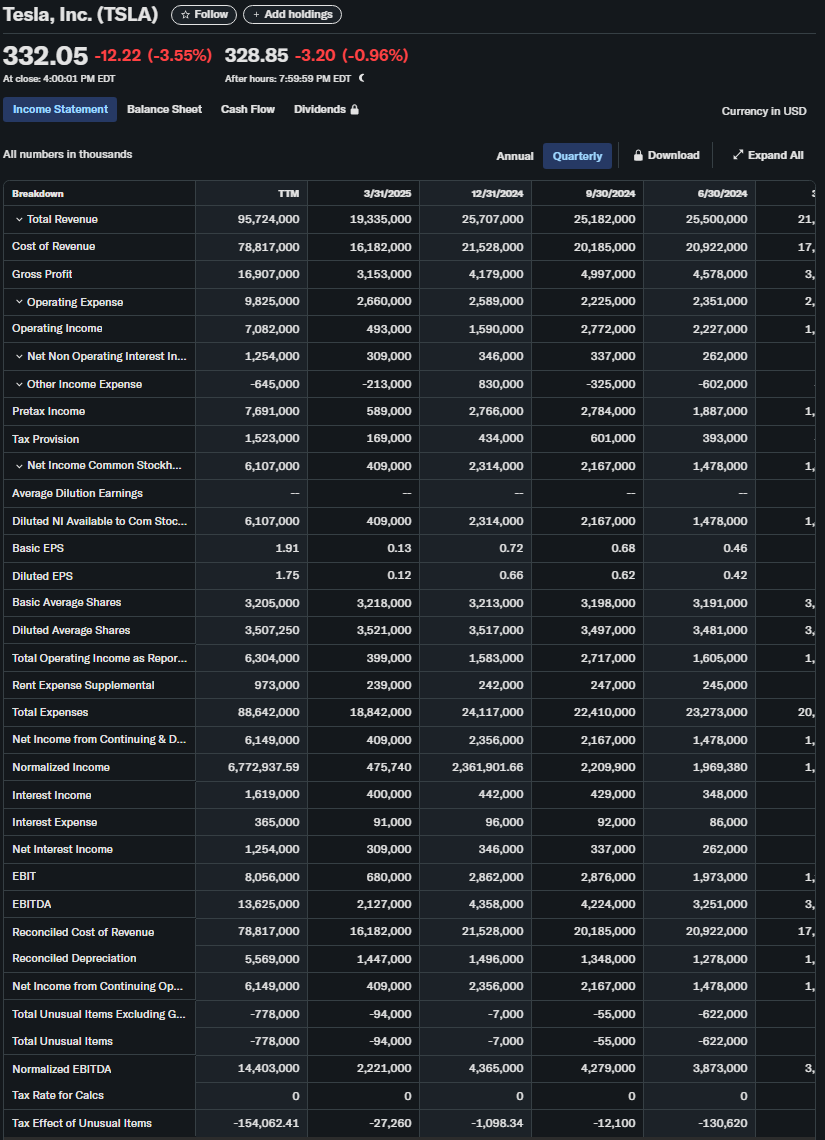
B. Income Statement Review (March 2024 ~ March 2025, Quarterly)
## Revenue, Operating Income, Net Income, and Diluted EPS - The most important things to show income statement
✅ 1. Revenue (Foundation of all profitability)
# Revenue Growth #
a. From $143.313B to $155.667B over 1 year → +8.6% YoY growth.
b. The strongest quarter was Q4 2024 about $187.792B because of holiday season sales (Christmas).
c. Q1 2025 declined from Q4 2024 but the total revenue in Q1 2025 maintained a strong growth trajectory, therefore, it remained above Q1 2024.
→ Insight : Revenue remained on a solid upward trend with Q1 2025 outperforming the same quarter in the prior year.
✅ 2. Operating Income (True Business Performance - profit from core operations before interest and taxes)
a. From $15.307B to $18.405B, the business performance was well grown across quarters.
b. The most highest income in Q4 2024 but in Q1 2025, it still outperformed about +20% after Q4 2024.
→ Insight : Amazon is improving operational efficiency even with higher cost of revenue, for example, operating income's upward trends.
See the contents below.
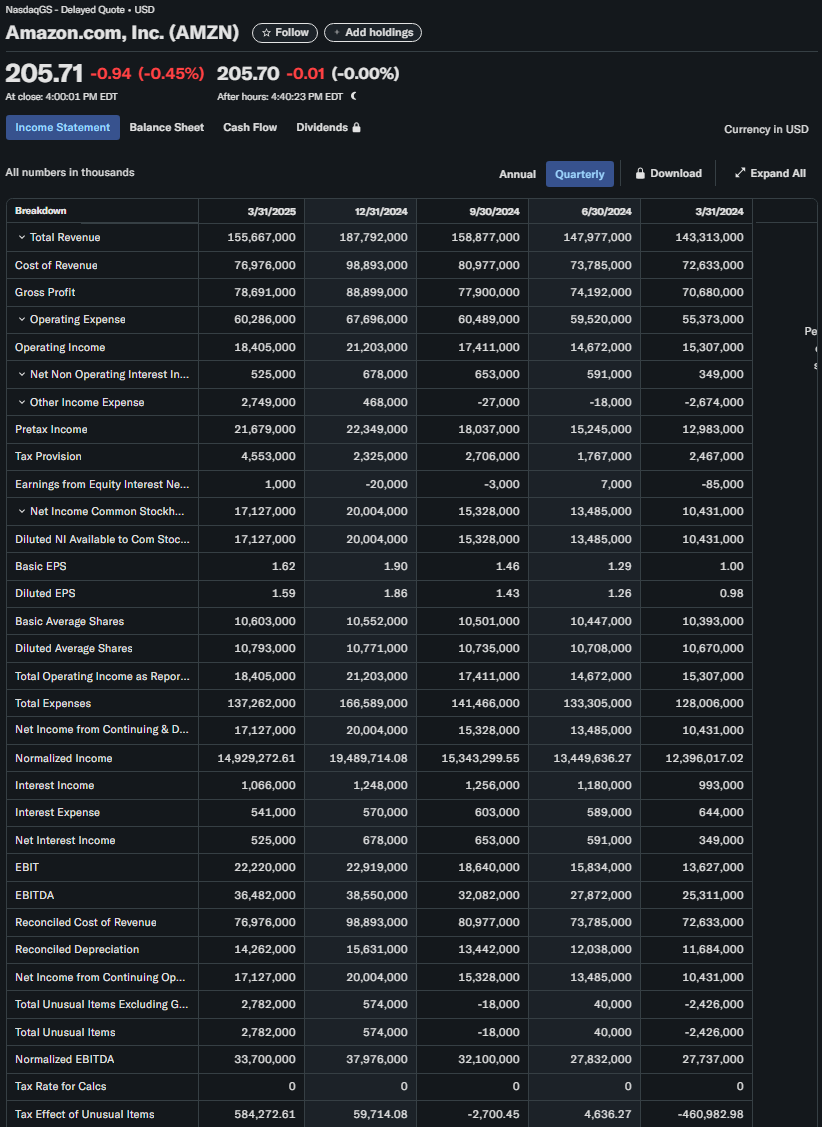
✅ 3. Net Income (Amazon's total profit)
a. From 10.431B to $17.127B (+64.2% YoY growth)
b. Peak Net Income in Q4 2024
c. In Q1 2025, there's a small dip but still significantly higher than any quarter before Q4 2024.
→ Insight : Profitability is increasing more rapidly than revenue. It suggest better cost management.
✅ 4. Diluted EPS (All possible stock dilution - critical valuation, ex) P/E ratio)
a. From $0.98 in Q1 2024 to $1.59 in Q1 2025, about +62% YoY growth.
b. EPS performance showed net income trend. (None of major dilution effects)
→ Insight : Strong earnings performance influenced healthy financial fundamentals to shareholders.
C. Income Statement Review (March 2024 ~ March 2025, Quarterly)
## Operating Cash Flow, Investing Cash Flow, Financing Cash Flow, End Cash Position, and Free Cash Flow.
✅ 1. Operating Cash Flow
a. Strong seasonal performance in Q4 2024 at $45.636B because of Christmas (holiday sales).
b. In Q1 2025, the price dropped to $17.016B.
→ Insight : Amazon is still generating positive operating cash flow but Q1 drop should be watched to see if it has a drop sign or a seasonal dip.
✅ 2. Investing Cash Flow
a. It consistently negative due to ongoing reinvestment in data centers (Amazon Web Service).
b. In Q1 2025, it hit a new low of -$29.803B but higher than the previous quarter because of Capital Expenditure, about $25.019B.
→ Insight : Amazon is aggressively reinvesting for long-term growth.
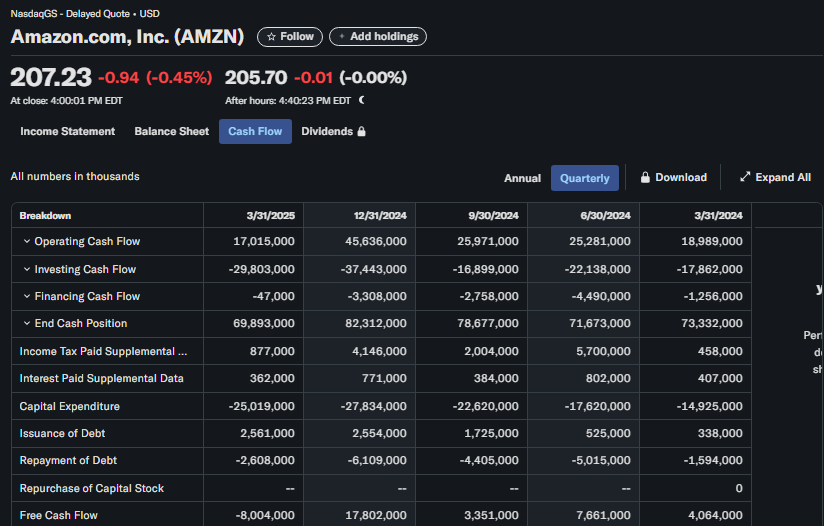
✅ 3. Financing Cash Flow
a. From -$1,2256,000 in Q1 2024 to -$47,000 in Q1 2025, became to be stable.
b. In Q1 2025, -$47,000 shows debt-related activity.
c. Repurchase of Capital Stock was none.
✅ 4. End Cash Position
a. End Cash Peaked at $82.312B in Q4 2024, then declined to $69.893B in Q1 2025.
b. It still strong overall but we should look for the reason of drop about $12.419B. The drop would be existed in Repurchase of Capital Stock.
✅ 5. Free Cash Flow
a. In Q4 2024, it showed a highly positive and the strongest FCF value of $17.802B among quarters.
b. In Q1 2025, FCF dropped to -$8.004B (The first negative quarter)
→ Insight : Negative FCF in Q1 2025 could raise concerns but it could be due to Capital Expenditure or the seasonal patterns (officially).
3. Financial Analysis - Amazon Valuation using two methods : Valuation Multiples & Discounted Cash Flow
A. Valuation Multiples Method
# Four Steps for Amazon Valuation Check with Valuation Multiples Method #
Step 1) Market cap Check = $2.2T (Amazon)
Step 2) Common Multiples Check :
Amazon Common Multiples Check
# Market cap Check = 2.2T (Amazon)
a. P/E ratio (Price to earnings)
Calculation : Market Cap / Net Income
= (Shares Outstanding × Share Price) / Net Income
= (10.613B × $207.23) / 17.13B
= $128.39B
b. EV/EBITDA
Calculation : (Market Cap + Total Debt - Cash) / EBITDA (Annualized)
= ($2.199T + $133.25B - $66.21B) / $36.48B
= ($2,199B + $133.25B - $66.21B) / $36.48B
= $62.11B
c. EV/Sales
Calculation : EV / Total Revenue (Annualized)
= $2,266.04B / $622.68B
= $3.64B
d. P/B ratio
Calculation : Market Cap / Book Value
= $2,199B / $305.87B
= $7.19B
Step 3) Comparison between Amazon and Apple, Google, Tesla in Q1 2025
Reasons why Apple, Google, Tesla other than the retail companies :
→ You may wonder why I chose them, not the retail companies. In terms of investment, the most important thing in the U.S. market was Nasdaq, S&P500, Exchange rate, and TQQQ as government bond futures. I experienced tech companies dominated the market's vitality in the stock market. Many charts could be an indicator, but because of the direction of the market, we should use and watch the tech companies.
Next time, I will do a fundamental analysis for Amazon compared to other retailers and analyze various U.S. government bond.
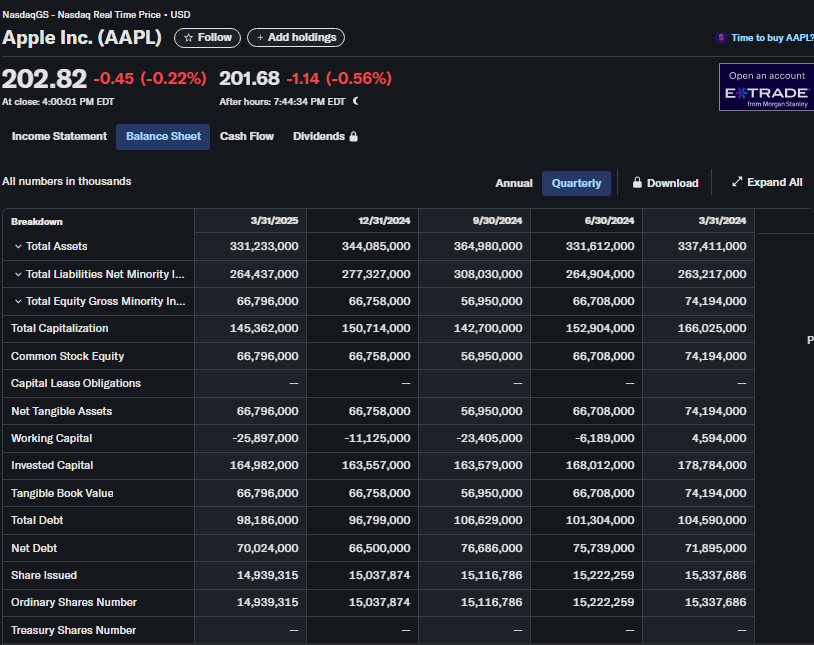
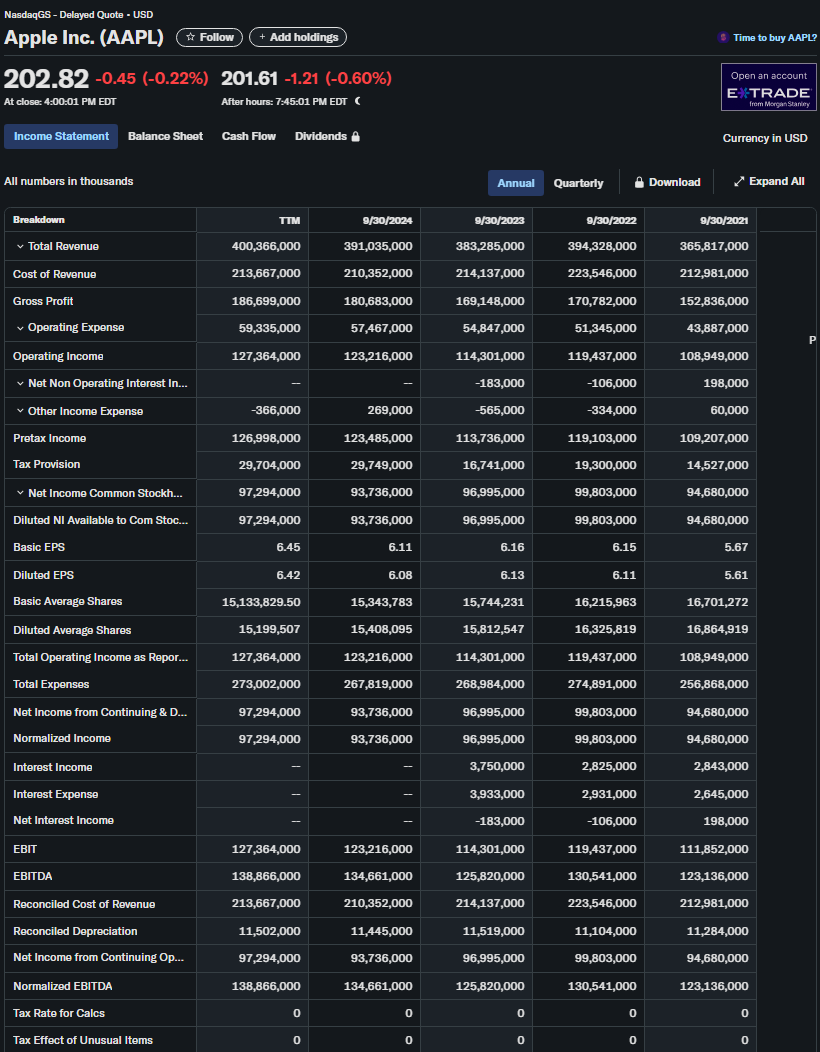
Below is Apple Financial Statements below (sources from Yahoo-Finance)
Apple Common Multiples Check
# Market cap Check = 3.1T (Apple)
a. P/E ratio (Price to earnings)
Calculation : Market Cap / Net Income
= (Shares Outstanding × Share Price) / Net Income
= 3,069.46 / 97.294
= $31.55B (approximately)
b. EV/EBITDA
Calculation : (Market Cap + Total Debt - Cash) / EBITDA
= EV / EBITDA
= 3,097.75 / 138.866
= $22.31B
c. EV/Sales
Calculation : EV / Total Revenue
= 3,097.75 / 400.37
= $7.74B
d. P/B ratio
Calculation : Market Cap / Book Value
= 3,069.46 / 66.796
= $45.95B
→ Google Financial Statements below (sources from Yahoo-Finance)
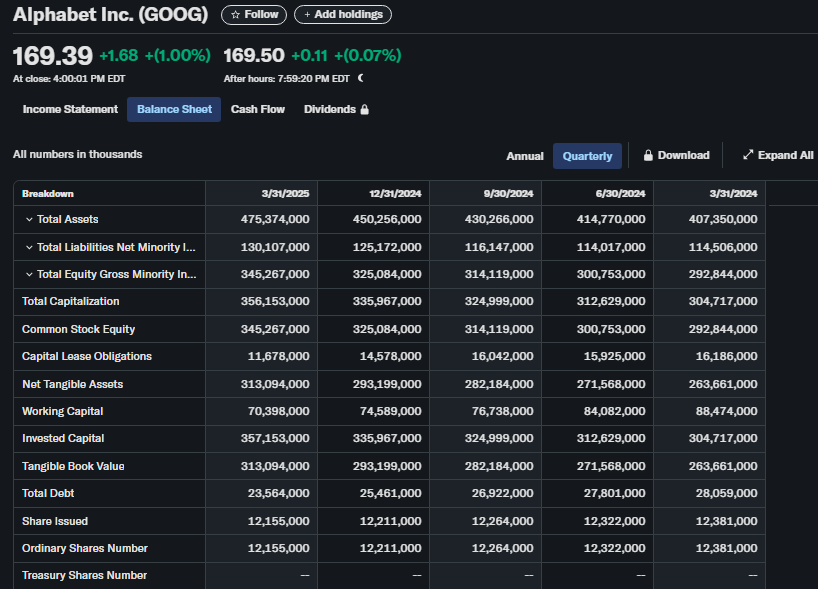
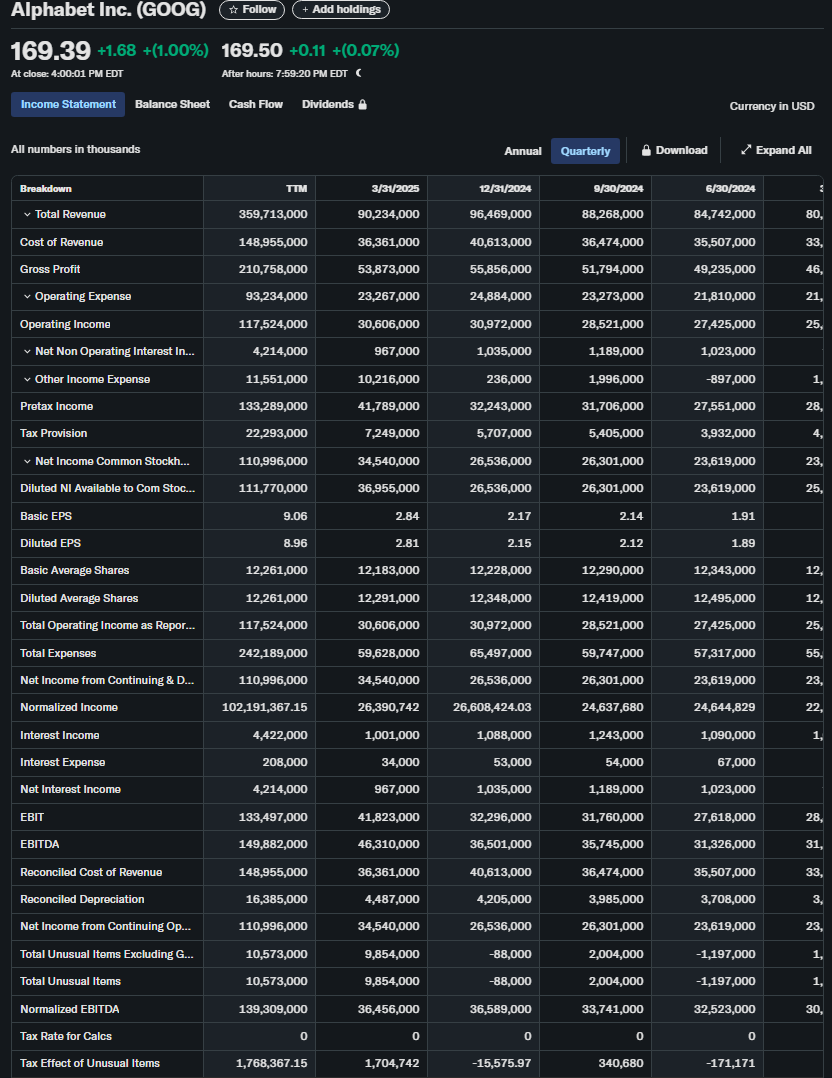
Google Common Multiples Check
# Market cap Check = 2.1T (Google)
a. P/E ratio (Price to earnings)
Calculation : Market Cap / Net Income
= (Shares Outstanding × Share Price) / Net Income
= 169.39 × 12.155B = 2,058.94B = 2.1T (Approximately) / Net Income
= 2,058.94 / 71.004
= $29B
b. EV/EBITDA
Calculation : (Market Cap + Total Debt - Cash) / EBITDA
= (2,058.94 + 23.564 - 108.155) / EBITDA= $1,974.34B / EBITDA
= EV / EBITDA
= 1974.34 / 148.48
= $13.3B
c. EV/Sales
Calculation : EV / Total Revenue
= 1974.34 / 359.713
= $5.49B
d. P/B ratio
Calculation : Market Cap / Book Value
= 2,058.94 / 345.267
= $5.96B
→ Tesla Financial Statements below (sources from Yahoo-Finance)
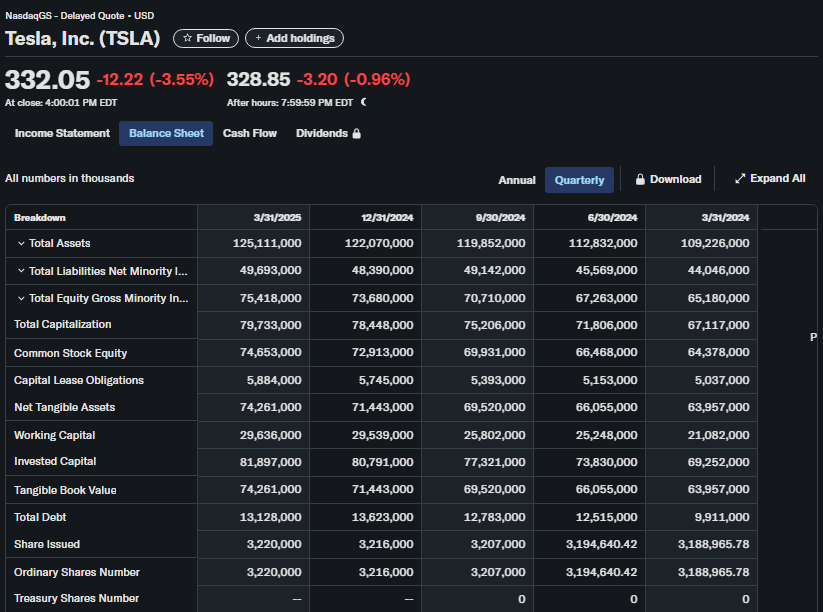
Tesla Common Multiples Check
# Market cap Check = 1.1T (Tesla)
a. P/E ratio (Price to earnings)
Calculation : Market Cap / Net Income
= (Shares Outstanding × Share Price) / Net Income
= (3.22 × 332.05) / 6.107
= 1,069.2B / 6.107B
= $175.08B
b. EV/EBITDA
Calculation : (Market Cap + Total Debt - Cash) / EBITDA
= (1069.2B + 13.13B - 19.84B) / EBITDA
= EV / EBITDA
= 1062.49B / 18.14B
= $58.58B
c. EV/Sales
Calculation : EV / Total Revenue
= 1062.49B / 95.72B
= $11.1B
d. P/B ratio
Calculation : Market Cap / Book Value
= 1069.2B / 75.42B
= $14.18B
Valuation Multiples Comparison Table and histogram (Q1 2025)
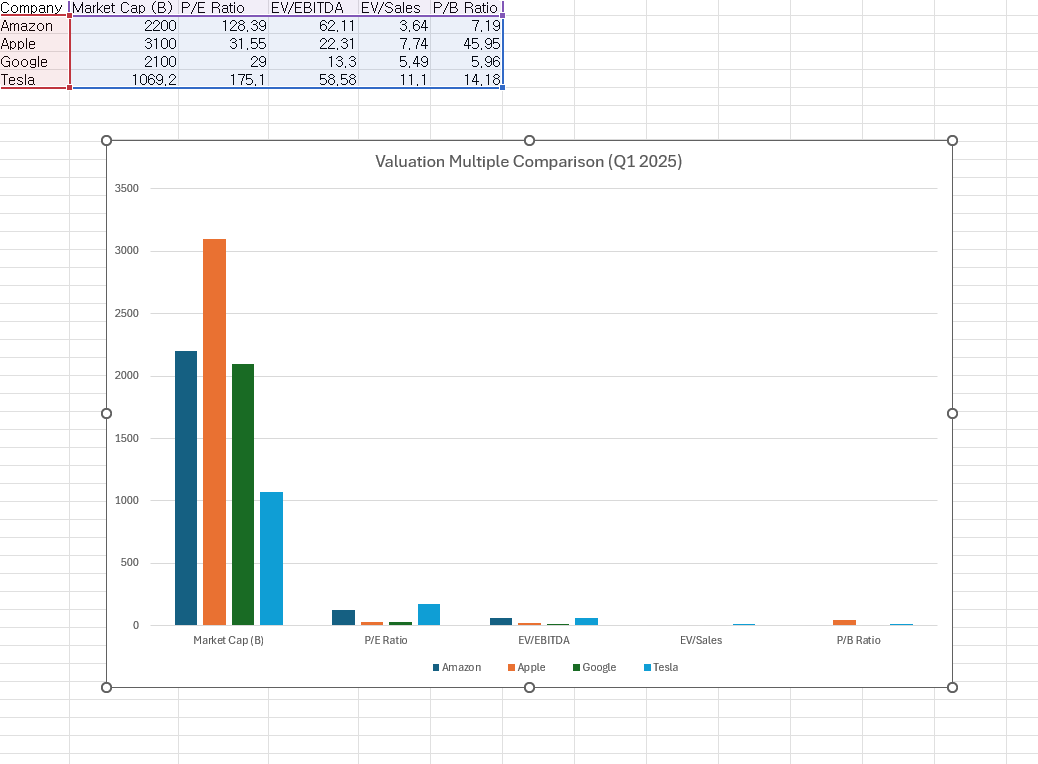
Valuation Check
Step 4) Amazon Valuation with the table above
# Assessment using Valuation Multiples Method for Amazon Valuation among other companies
Amazon is overvalued because it valued expensively in terms of earnings (P/E Ratio) and operating cash (EV/EBITDA) but cheaper on sales (EV/Sales) and book value (P/B Ratio) than Apple and Tesla. From Valuation Multiples Comparison Table above, we can see that Amazon has a much higher valuation than Google and Apple.
It demonstrates our expectations for future operating margin improvement of Amazon Web Service.
It is not as inflated as Tesla in terms of multiples, but still not as efficient as Google. In conclusion, if Amazon's earnings are improved in the future, the valuation would justify itself. However, it is too expensive relative to current profitability.
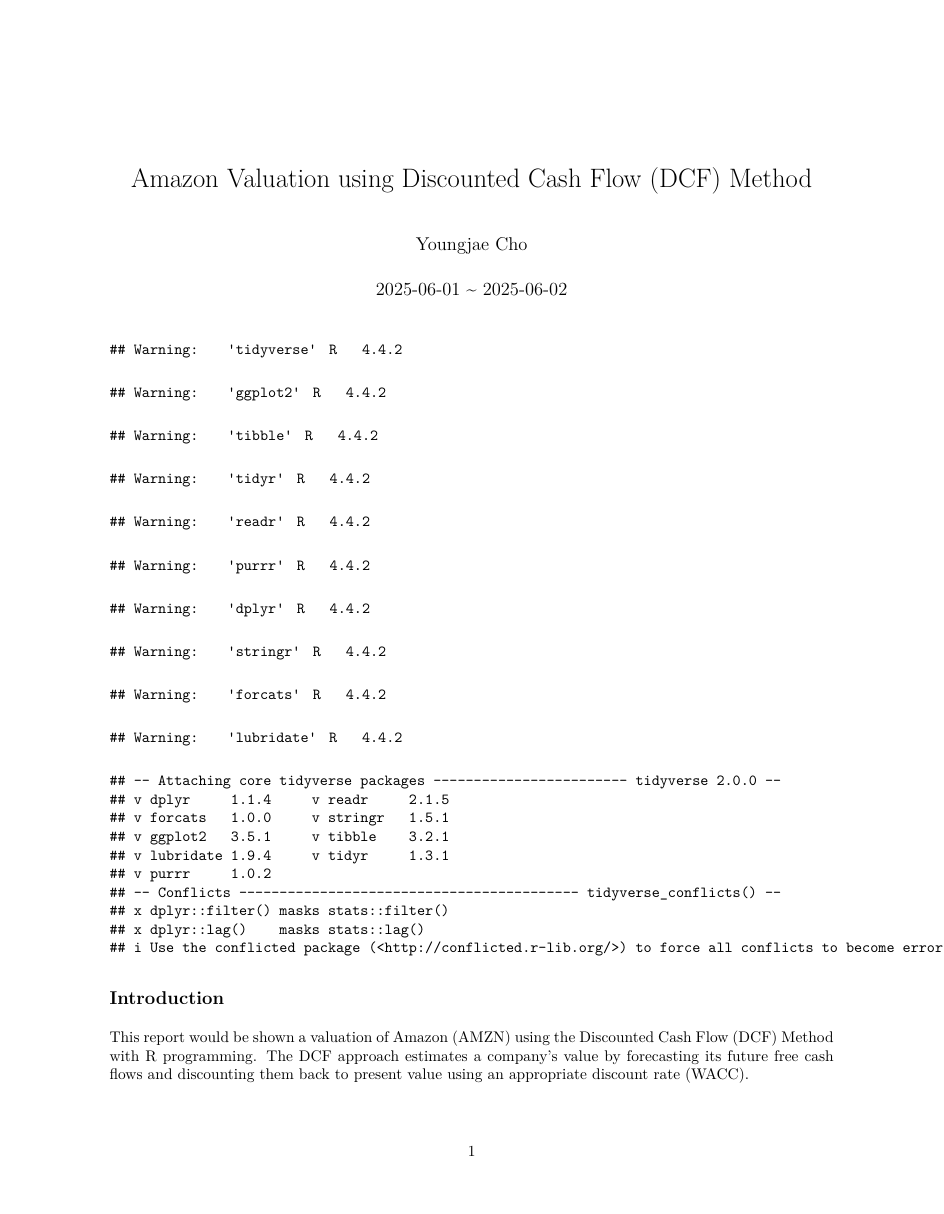
B. Discounted Cash Flow Method using R programming language
# R-Markdown includes four parts : Introduction, Data, Results, and Discussion.
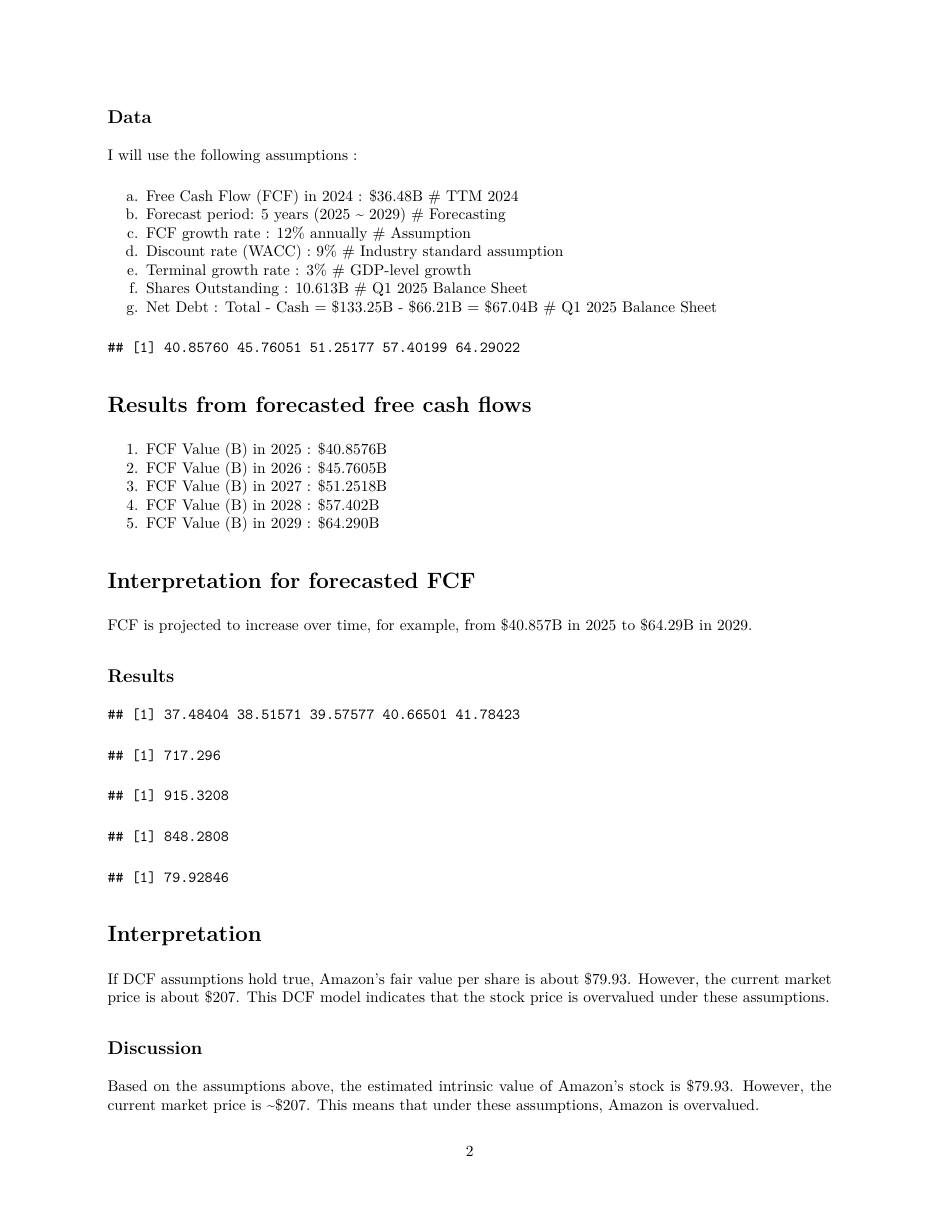
# Assumptions below:
a. Free Cash Flow (FCF) in 2024 : $36.48B (TTM 2024)
b. Forecast period: 5 years (2025 ~ 2029) (Forecasting)
c. FCF growth rate : 12% annually (Assumption)
d. Discount rate (WACC) : 9% (Industry standard assumption)
e. Terminal growth rate : 3% (GDP-level growth)
f. Shares Outstanding : $10.613B (Q1 2025 Balance Sheet)
g. Net Debt : Total- Cash = $133.25B- $66.21B = $67.04B (Q1 2025 Balance Sheet)
Below is a R-Markdown pdf file screenshot for Amazon Valuation with Discounted Cash Flow (DCF) method
Conclusion
To sum up, Amazon stock price is overvalued based on its earnings (P/E Ratio) and operating cash flow (EV/EBITDA), but relatively undervalued on a sales basis (EV/Sales) and book value (P/B Ratio) compared to Apple and Tesla. According to the valuation multiples comparison among other companies, Amazon trades at a significantly higher valuation than Google and Apple overall.
Also, in terms of Discounted Cash Flow Method, future free cash flows Amazon stock price is overvalued because based on the assumptions above, the estimated intrinsic value of Amazon's stock price is $79.93 but the current market price is ~$207. For these reasons, the current Amazon market price is overvalued.
Next Step is doing technical Chart Analysis for Amazon.
I will analyze the past and current prices for forecasting.