# Amazon (AMZN)
1. Amazon.com, Inc - Weekly Chart Analysis
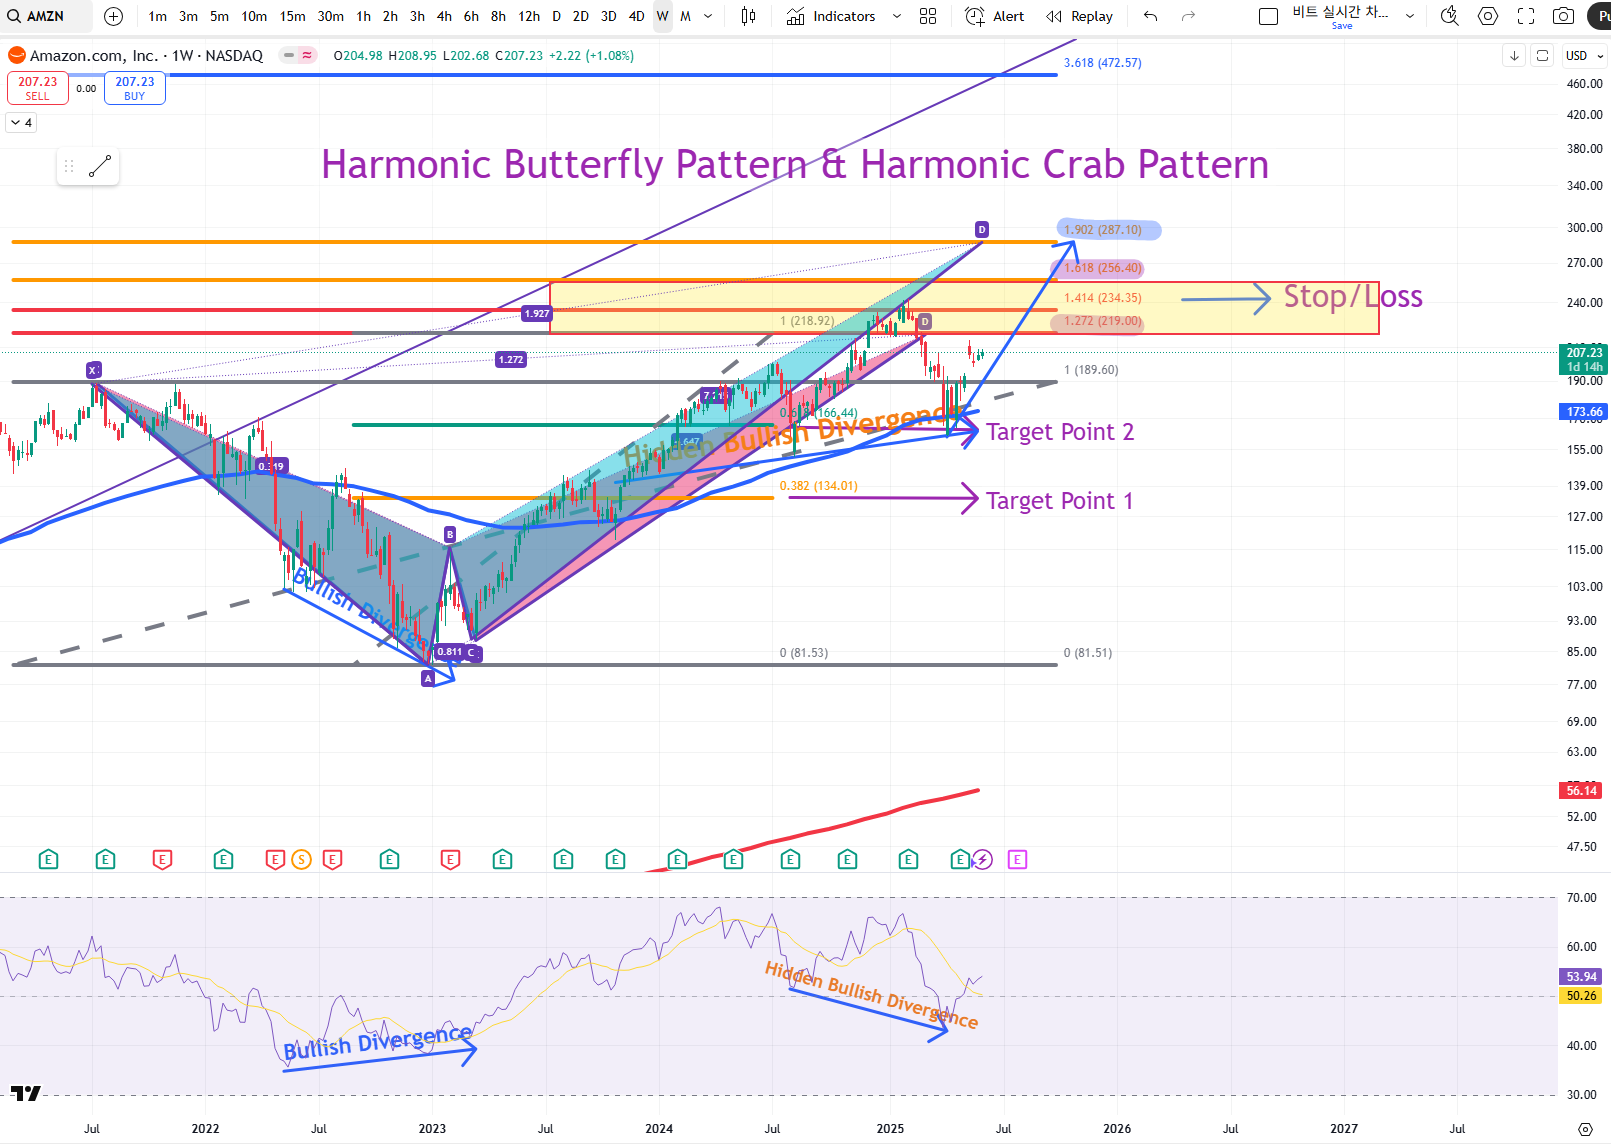
Chart Source : TradingView (1W Interval)
Tool Used : EMA(30), MA(200), Fibonacci Retracement, Harmonic Crab and Butterfly Patterns, RSI(30)
Technical Case Study: Harmonic Pattern Analysis on Amazon (AMZN)
# Current Information
a. Timeframe : Weekly Chart
b. Current Price : $207
c. Pattern : Harmonic Butterfly (Possibly Evolving into Crab Pattern)
1. Pattern Identification
a. XA : High formed in July 2021 after the Covid-19 pandemic bull market and the low at A on January 2023.
b. Point B : It located around XA Fibonacci 0.786 retracement → Met Butterfly pattern condition.
c. However, since the Point B is also close to 0.618 retracement of XA, the structure could evolve into a Crab pattern.
2. Harmonic Butterfly Pattern (Confirmed)
a. Point D : It reached the minimum Potential Reversal Zone (PRZ) at 1.272 level (~$219)
b. Price bounced at the first Fibonacci target (Fib 0.382) and supported at the second Fibonacci target (0.618).
c. RSI(30) indicated a hidden bullish divergence at the 0.618 pullback zone and confirmed upward reversal potential.
d. The weekly candle also bounced above the EMA(30). Therefore, we assume the further bullish market.
3. Potential Target Zones
a. The target 1 was Fibonacci 0.382 section, $134.01 for support line.
b. The target 2 was Fibonacci 0.618 section, $166.44, where hidden bullish divergence appeared.
c. The target 3 is Fibonacci 1.272 PRZ section, $219, that is minimum PRZ reached.
d. Stop / Loss is Fibonacci 1.414, $256.4, and here is strong resistance line.
e. Maximum PRZ(Butterfly pattern) section : Fibonacci 1.618, $256.4, that is also the strong resistance line.
f. Maximum PRX(Crab pattern) section : Fibonacci 1.902, that is extreme extension if the butterfly pattern evolved to Crab pattern.
4. Technical Indicators
a. EMA(30) : Price currently above and this indicates bullish support.
b. MA(200) : Long-term move average support line still far below.
c. RSI(30) : Hidden bullish divergence + bounced above 50 = Bullish momentum shift.
d. Stochastic Oscillator shows reversal signals in oversold zone.
Conclusion
To sum up, Harmonic Butterfly Pattern has been confirmed with multiple confluences at $219.
Two scenarios appeared below :
If the candle in weekly cycle breaks $234.35 (stop / loss section for butterfly pattern), it could be evolved into a Harmonic Crab pattern, then projected upside to $287.1. This weekly chart indicates a medium-term bullish setup based on harmonic structures and momentum indicators. However, after the stock price reaches $287.1, since this section has a high probability to be a resistance line, it is necessary to carefully examine the short-term division cycle to see if the price serves as a support or resistor. Other than that, Amazon prices are on the bullish cycle in the medium-term.
Next step is for risk modeling with Monte Carlo Simulation and VaR Analysis for Amazon.